Project overview
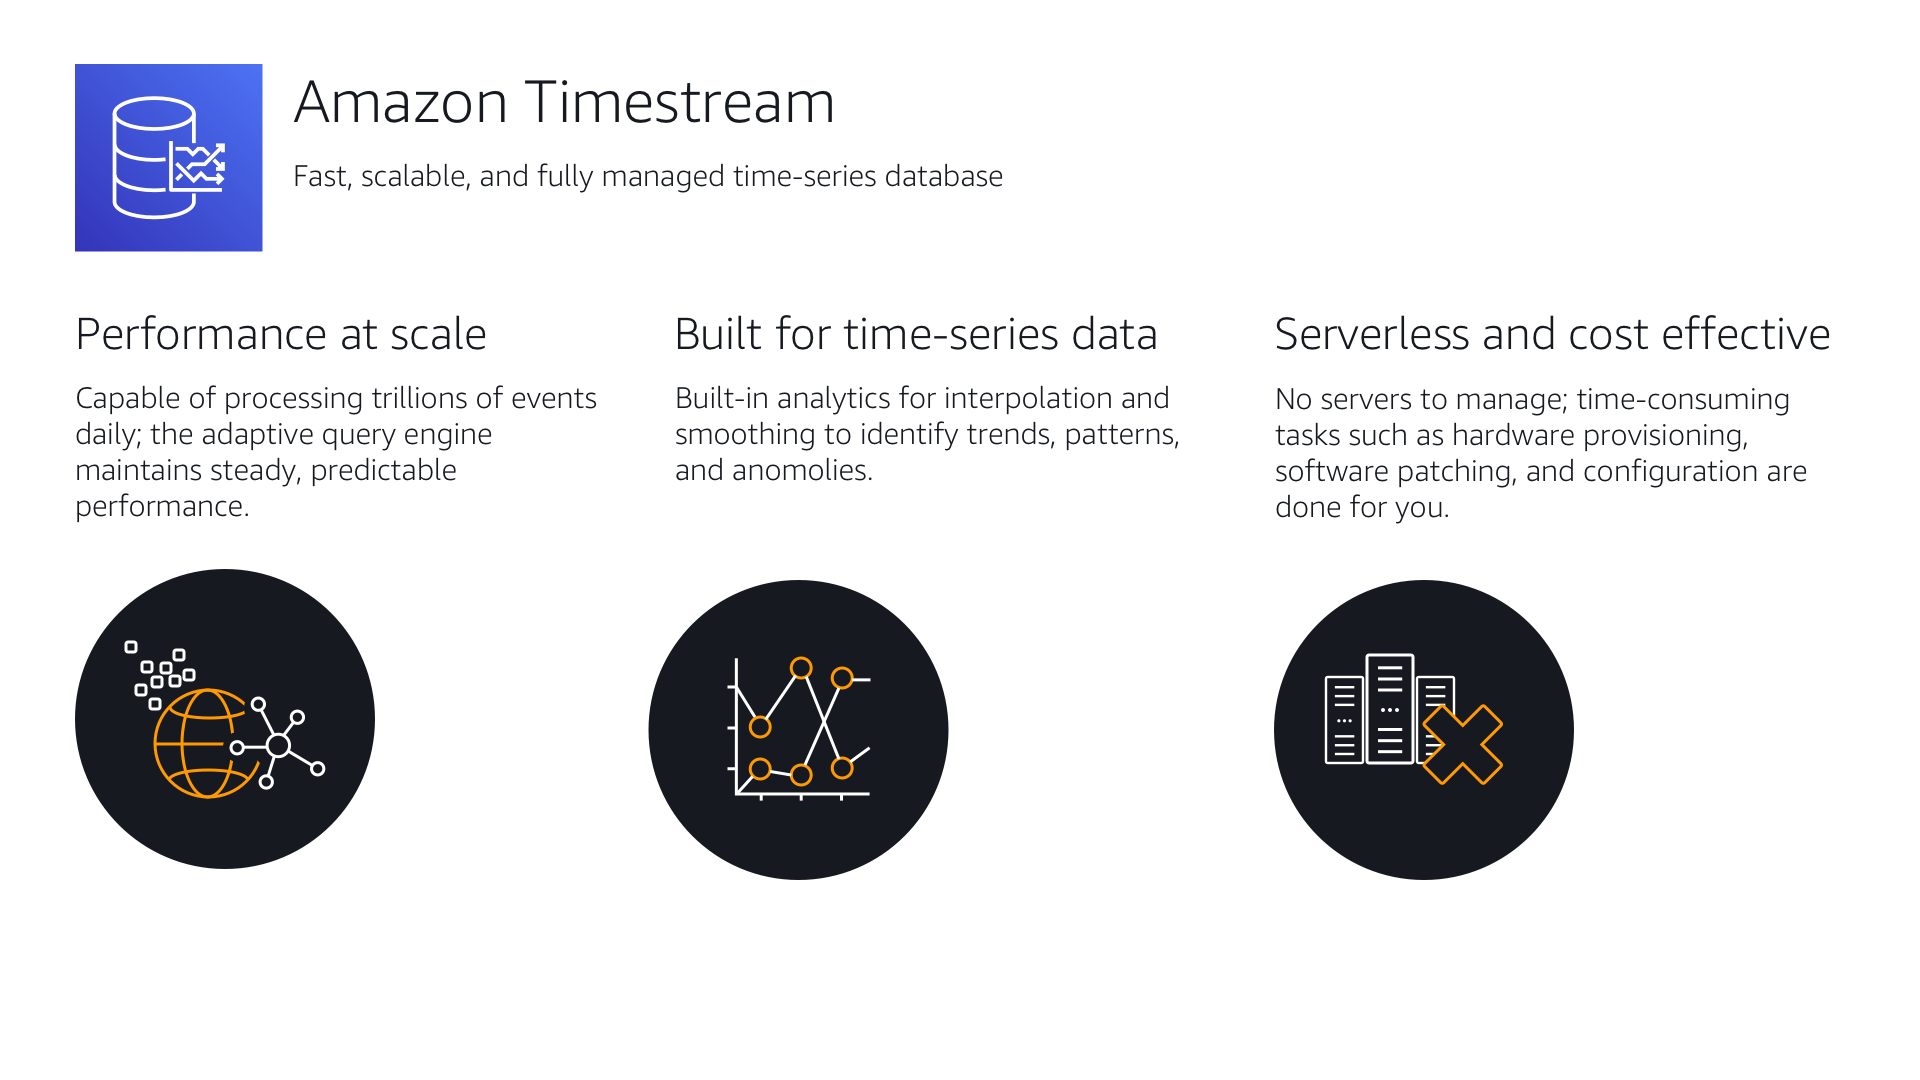
Amazon Timestream is a time-series database meant to handle large volumes of data at scale. Customers needed an easy way to convert their time-series data to a model schema to make it available for query. In this project, we looked at how customers import, structure, and query their database schema so they can use it to quickly derive insights and business value. We designed a table structure that would permit multi-column values within a cell, so that users could work with their data in Timestream.
Time Series Data
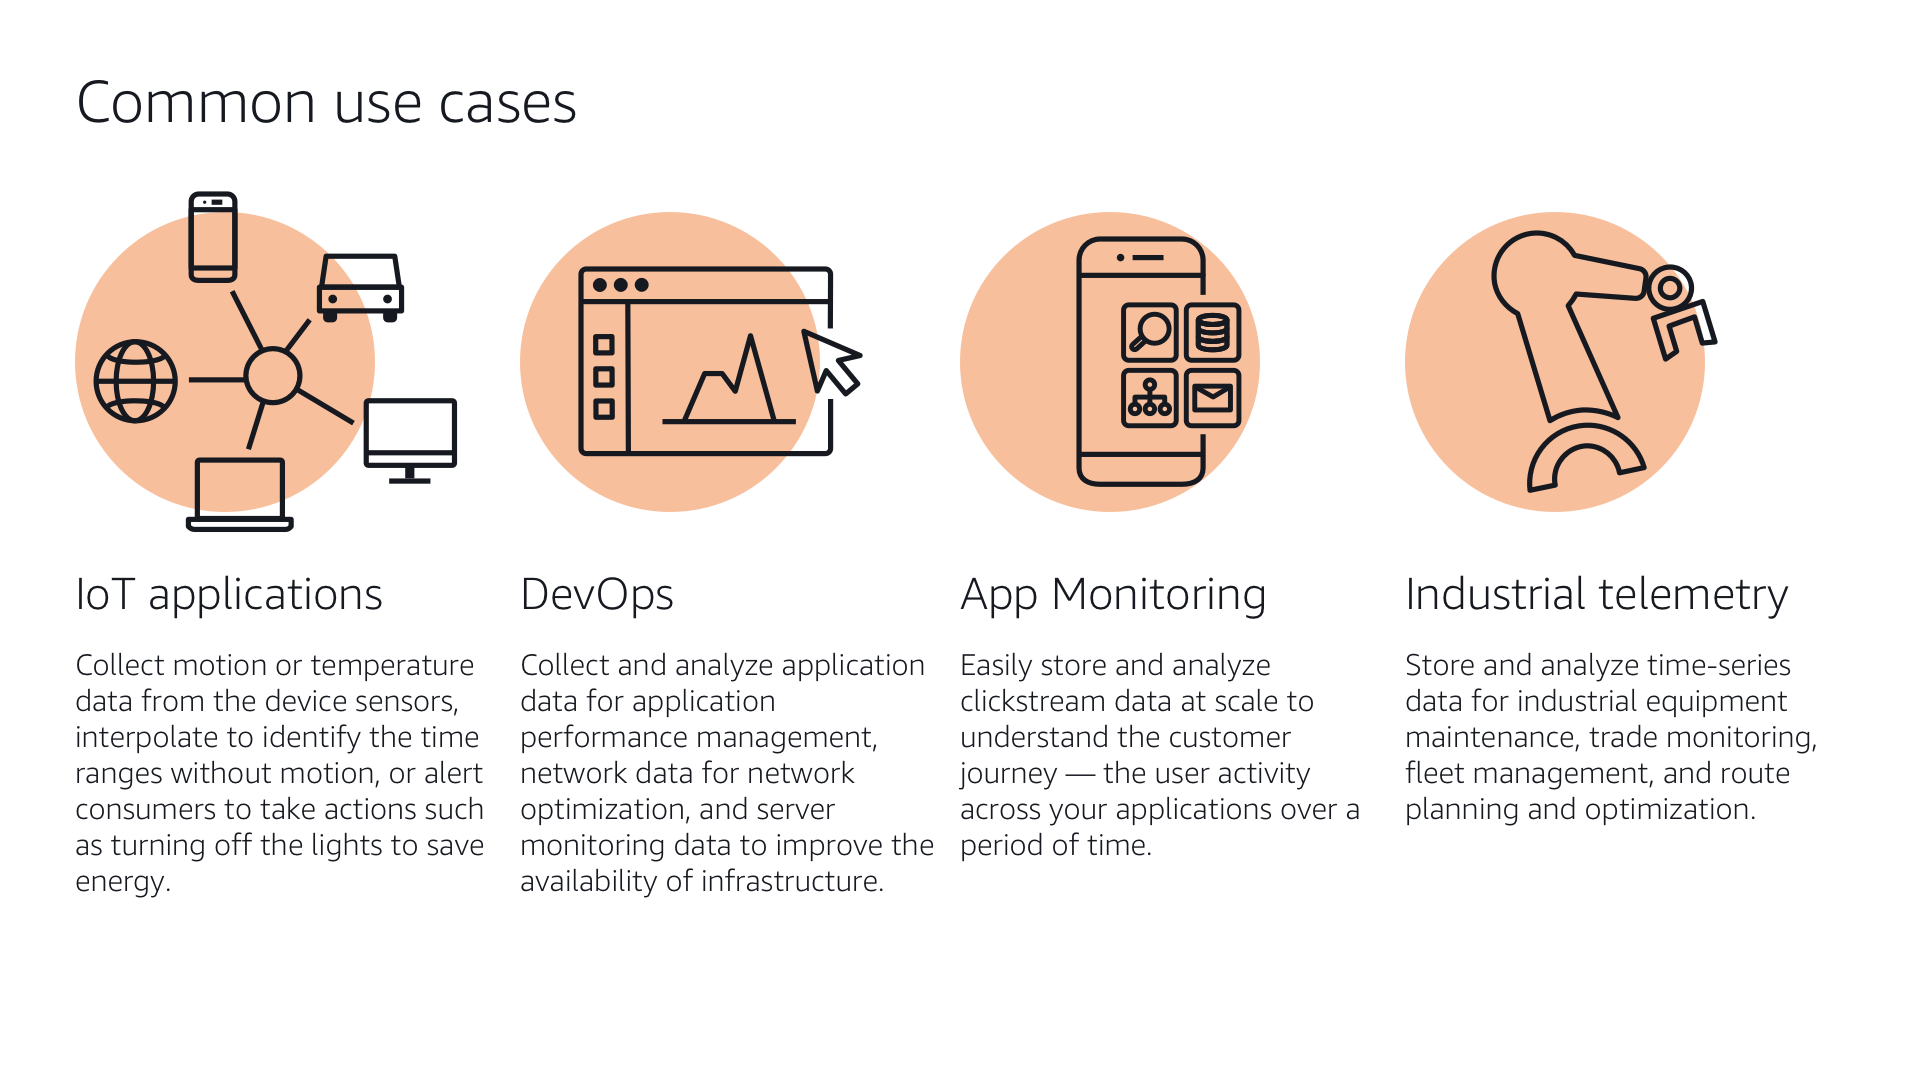
Everyday devices emit near constant streams of data representing measurements, location, temperature, and activity. Customer use cases include data received from manufacturing robots, vehicle fleets, weather satellites, and application system operations. Data is collected and stored with a timestamp at high volumes. In this project, I created a mental model of the structure of incoming customer data alongside the desired time-series data format, so that we could convert and display it to customers in a familiar way.
Developer Persona
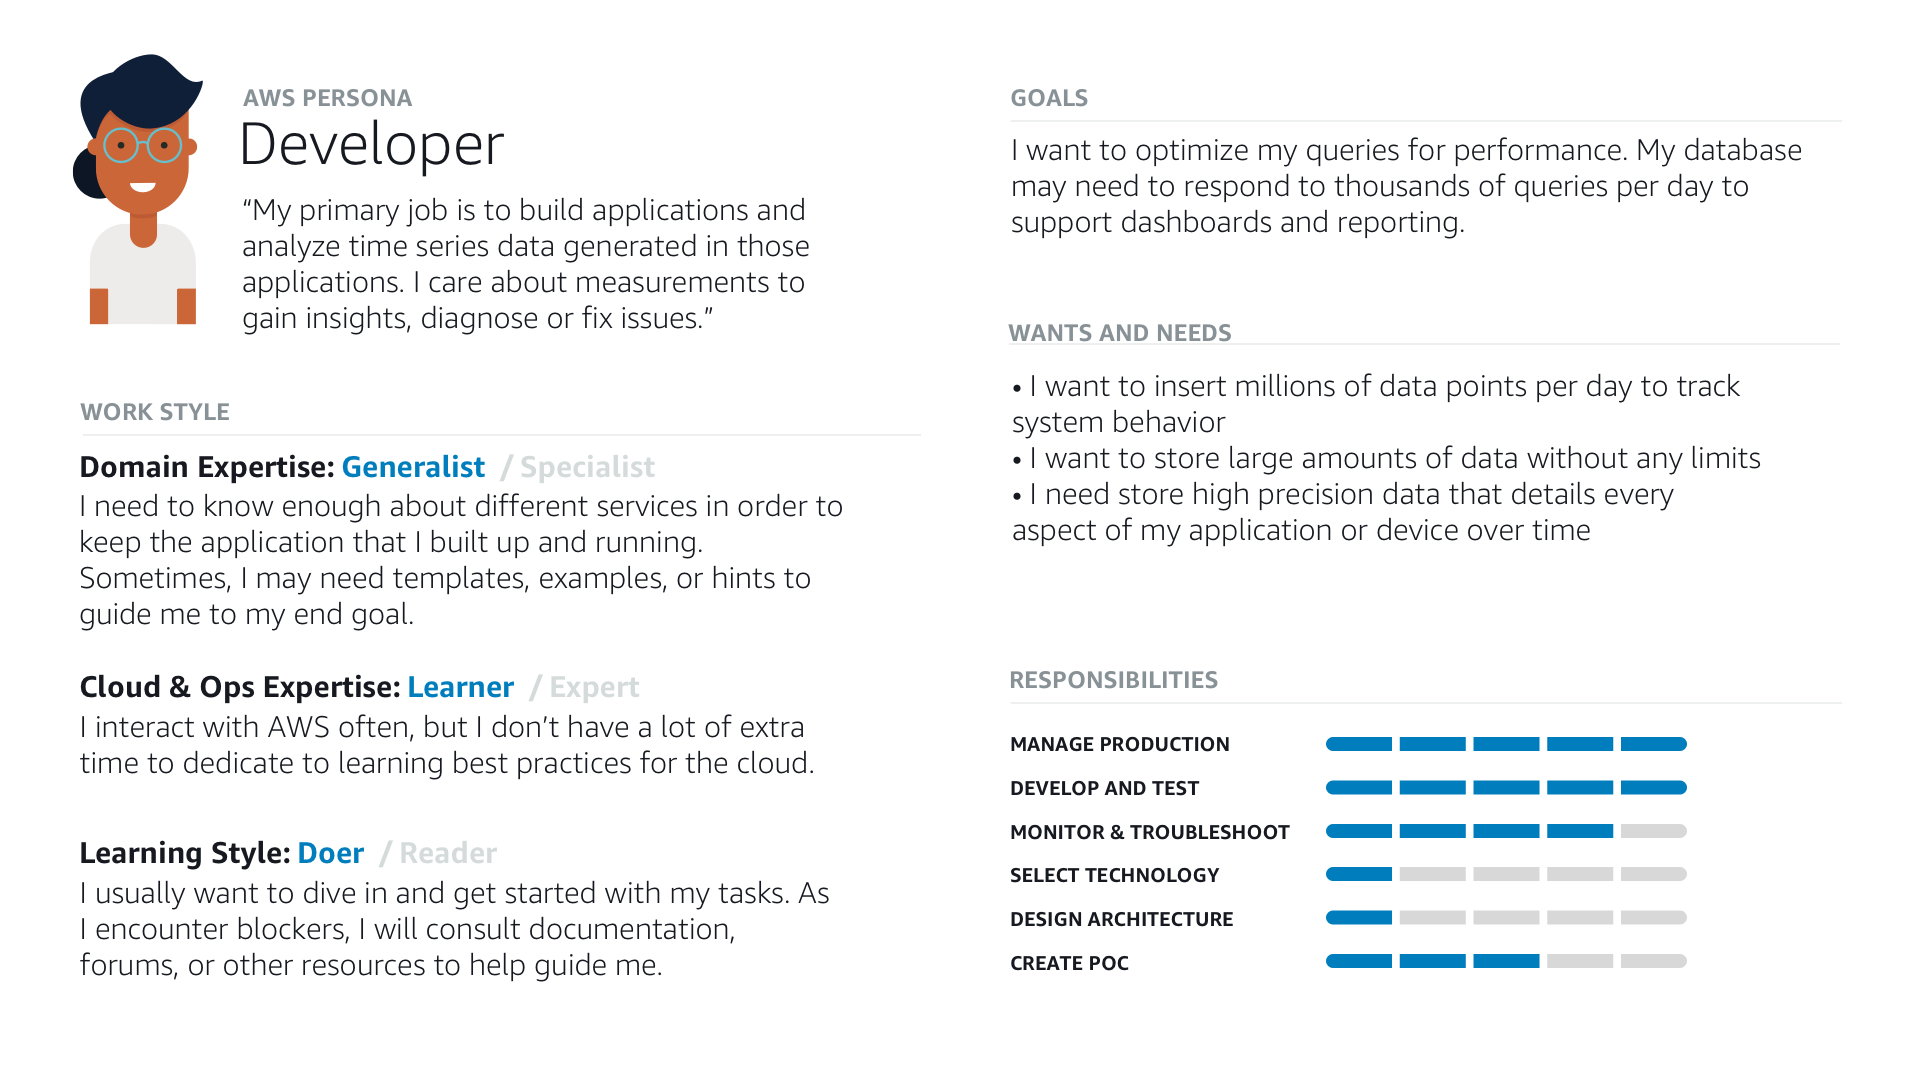
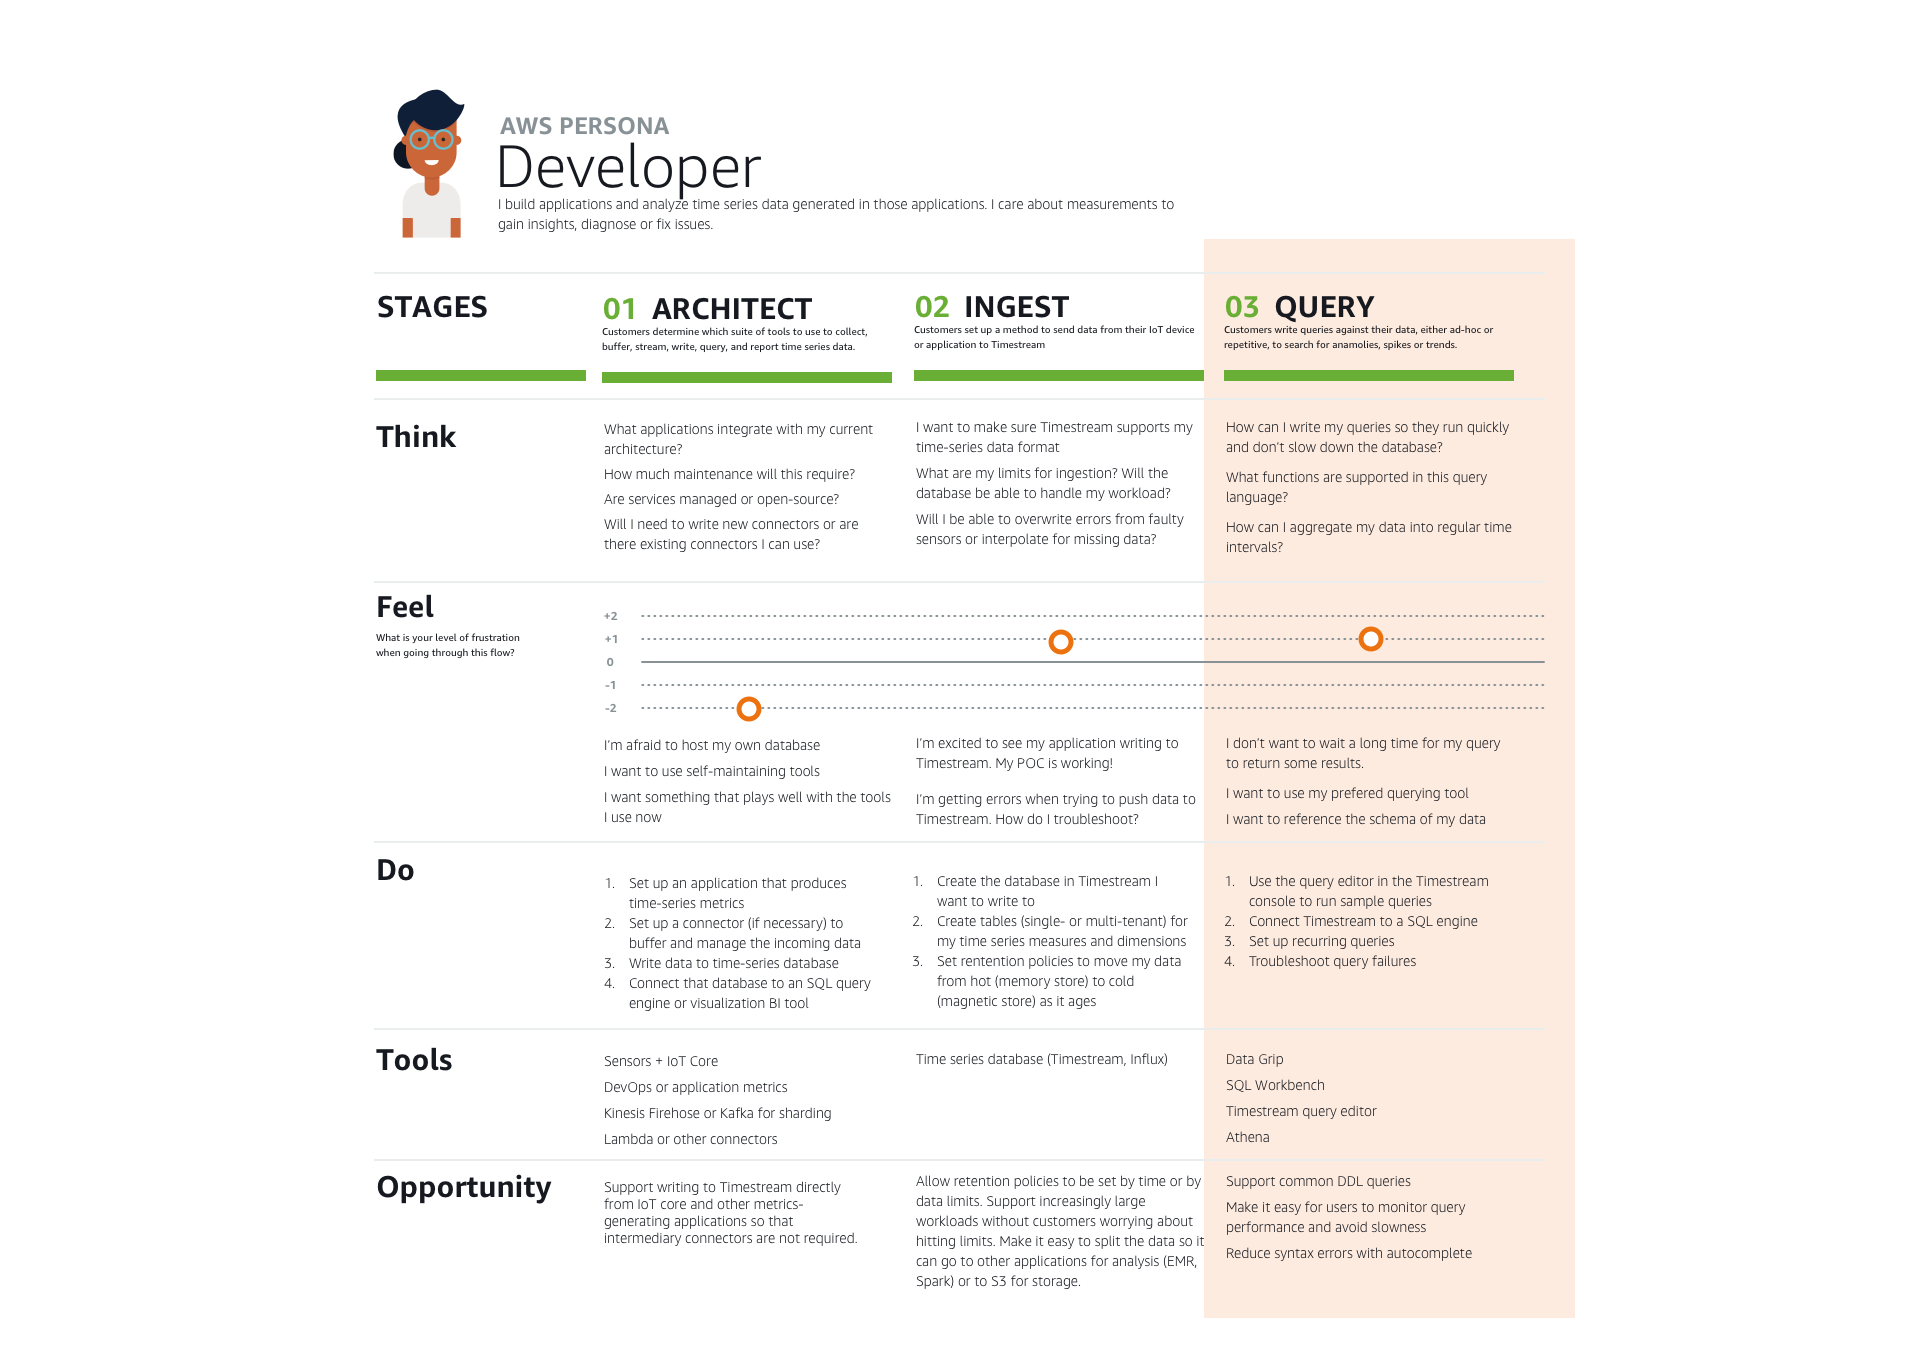
To better understand our customer, I researched job roles involving time series data, and attended over 50 customer calls with our product management team. I created a persona description and customer journey map to help the UX team understand the user’s motivations, pain points, and goals while running queries in Timestream.
Workflow diagram
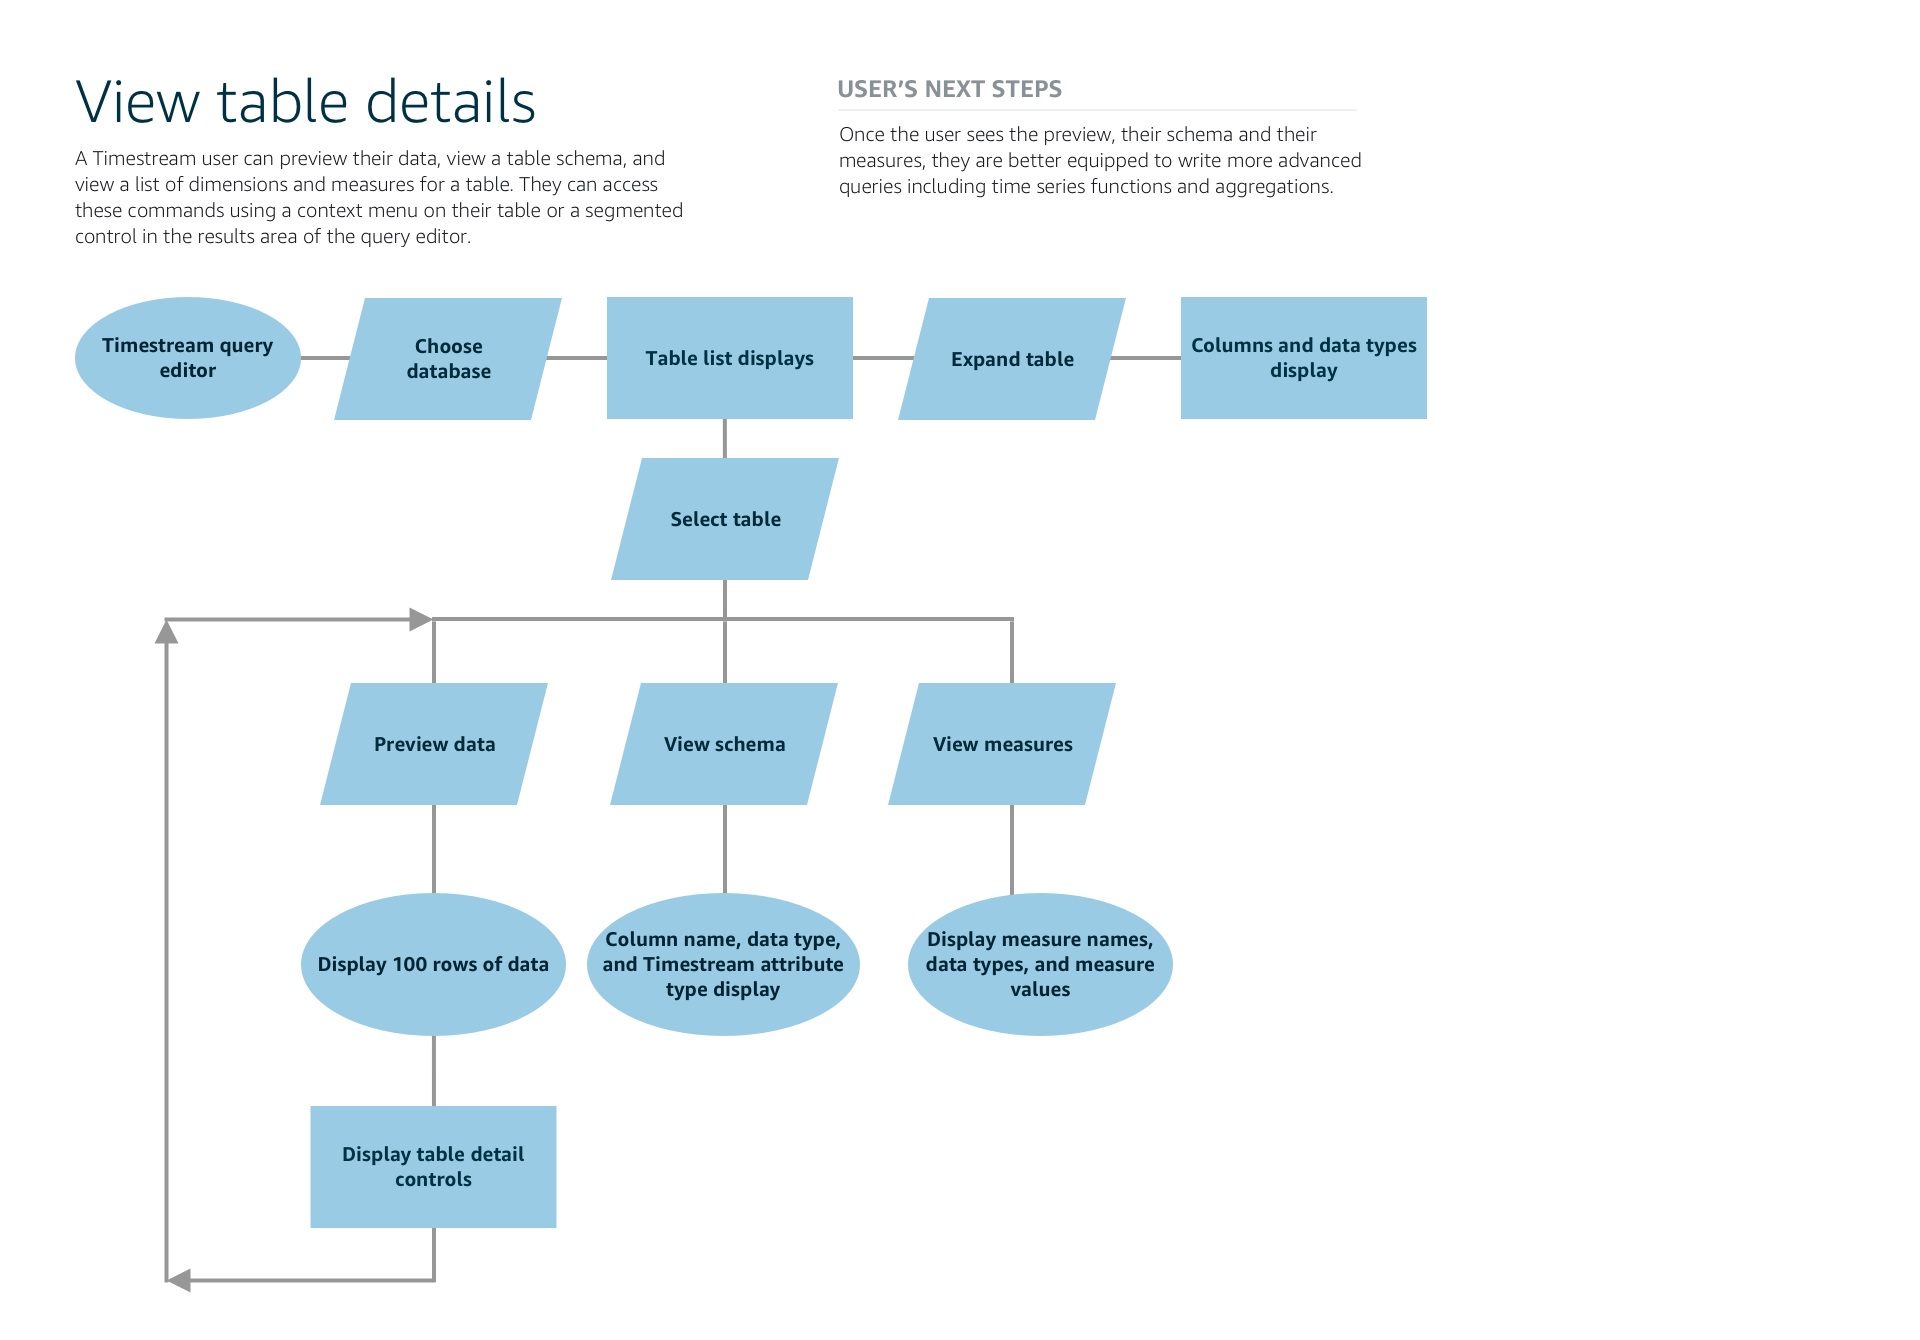
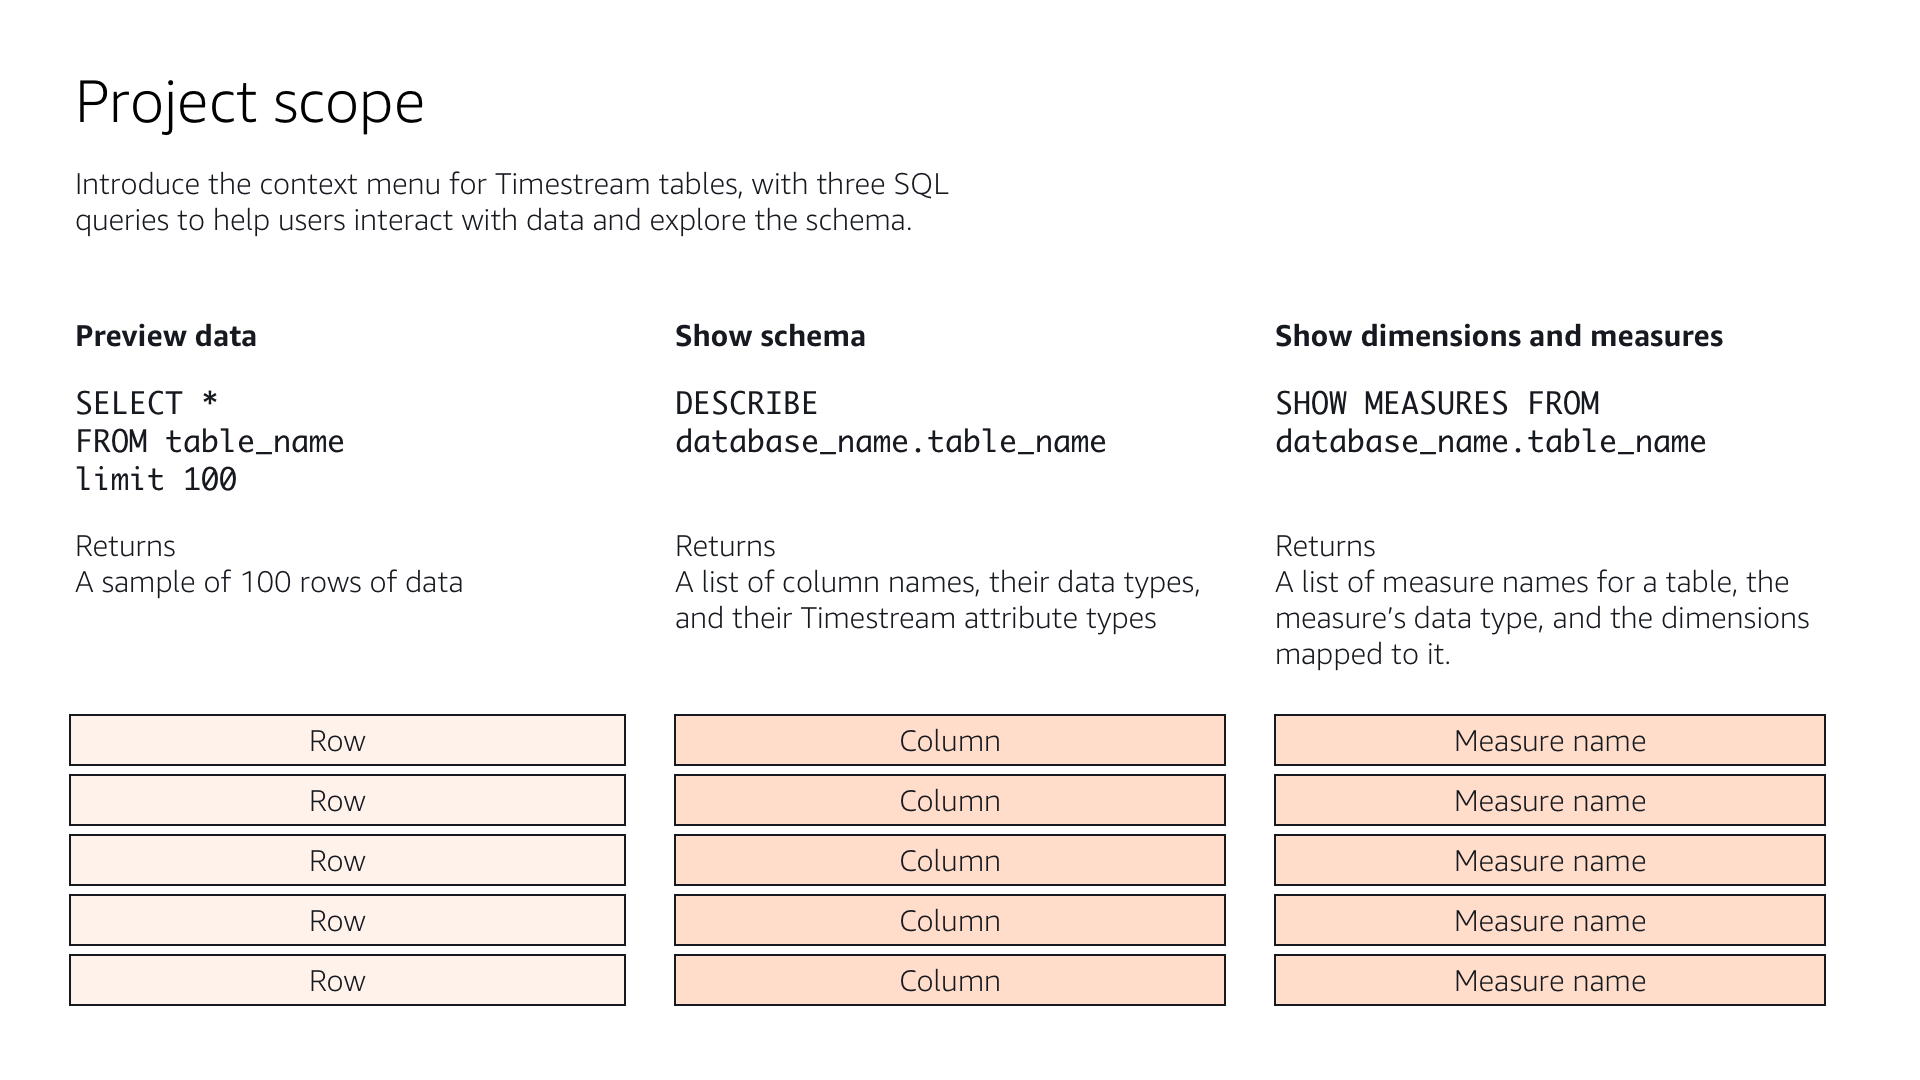
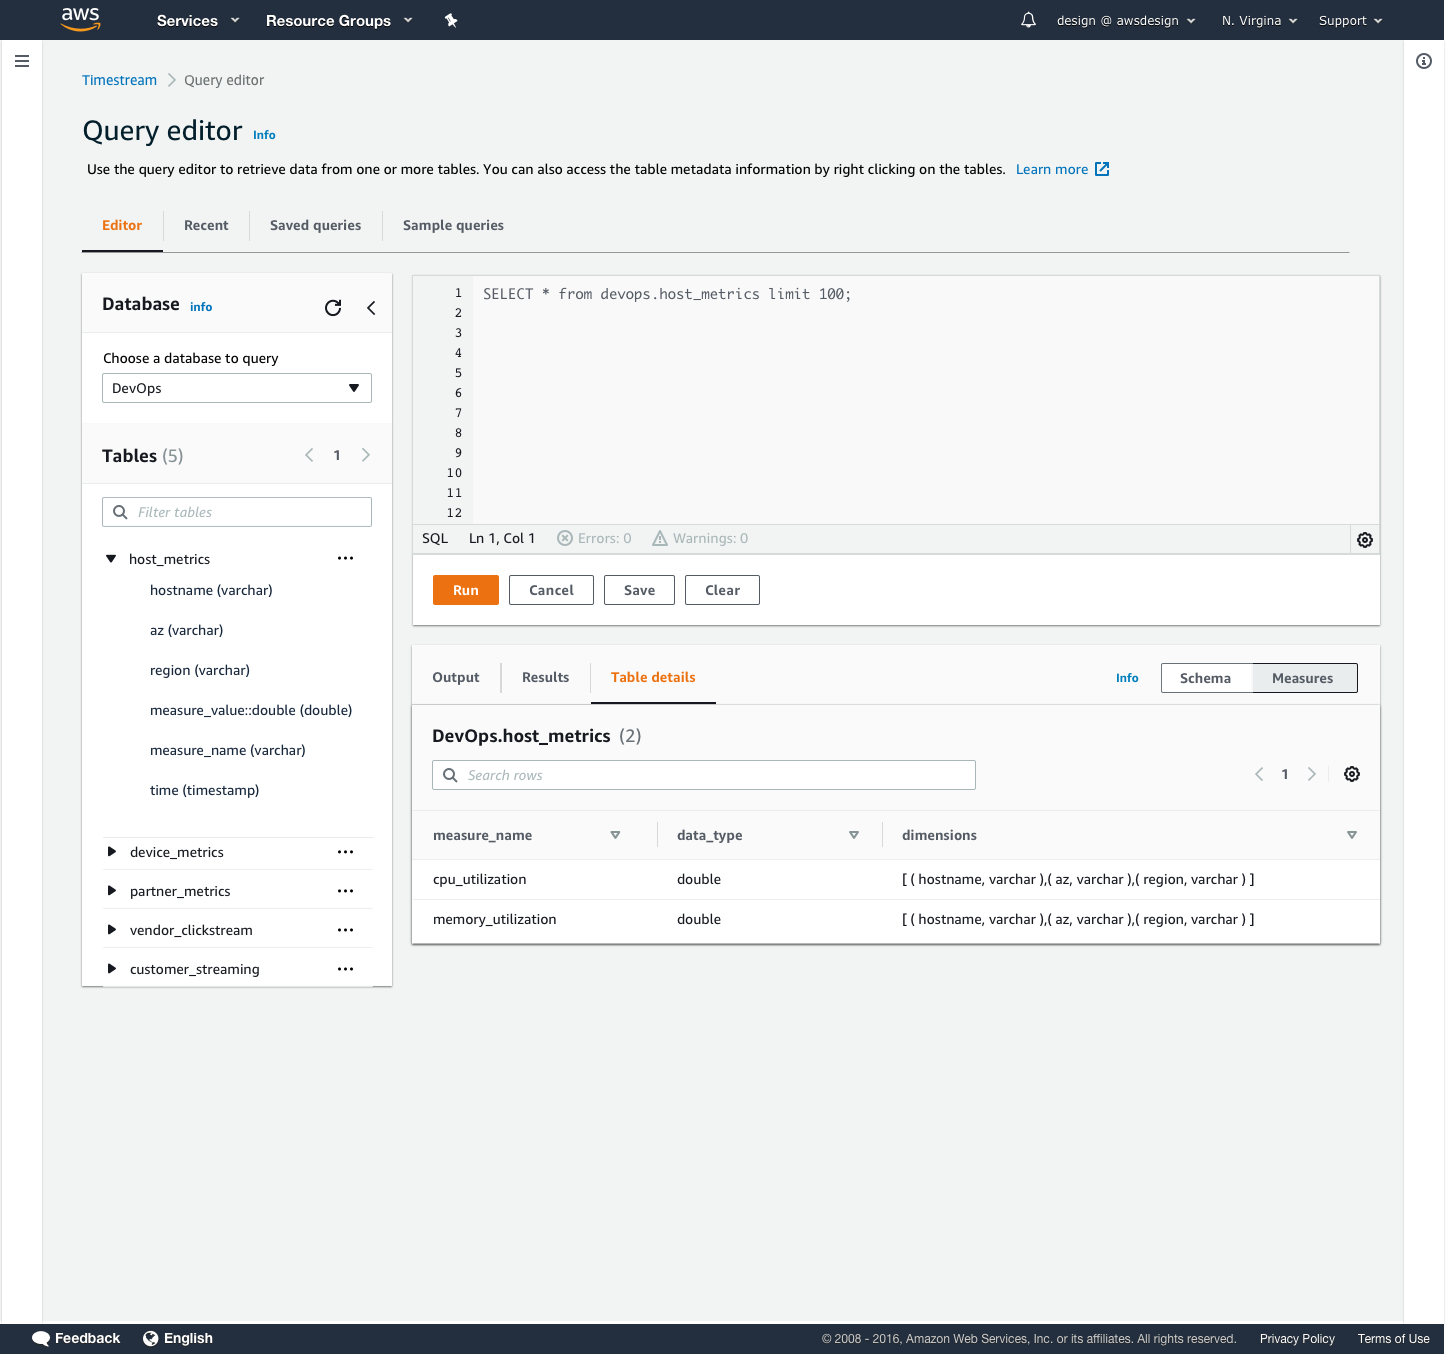
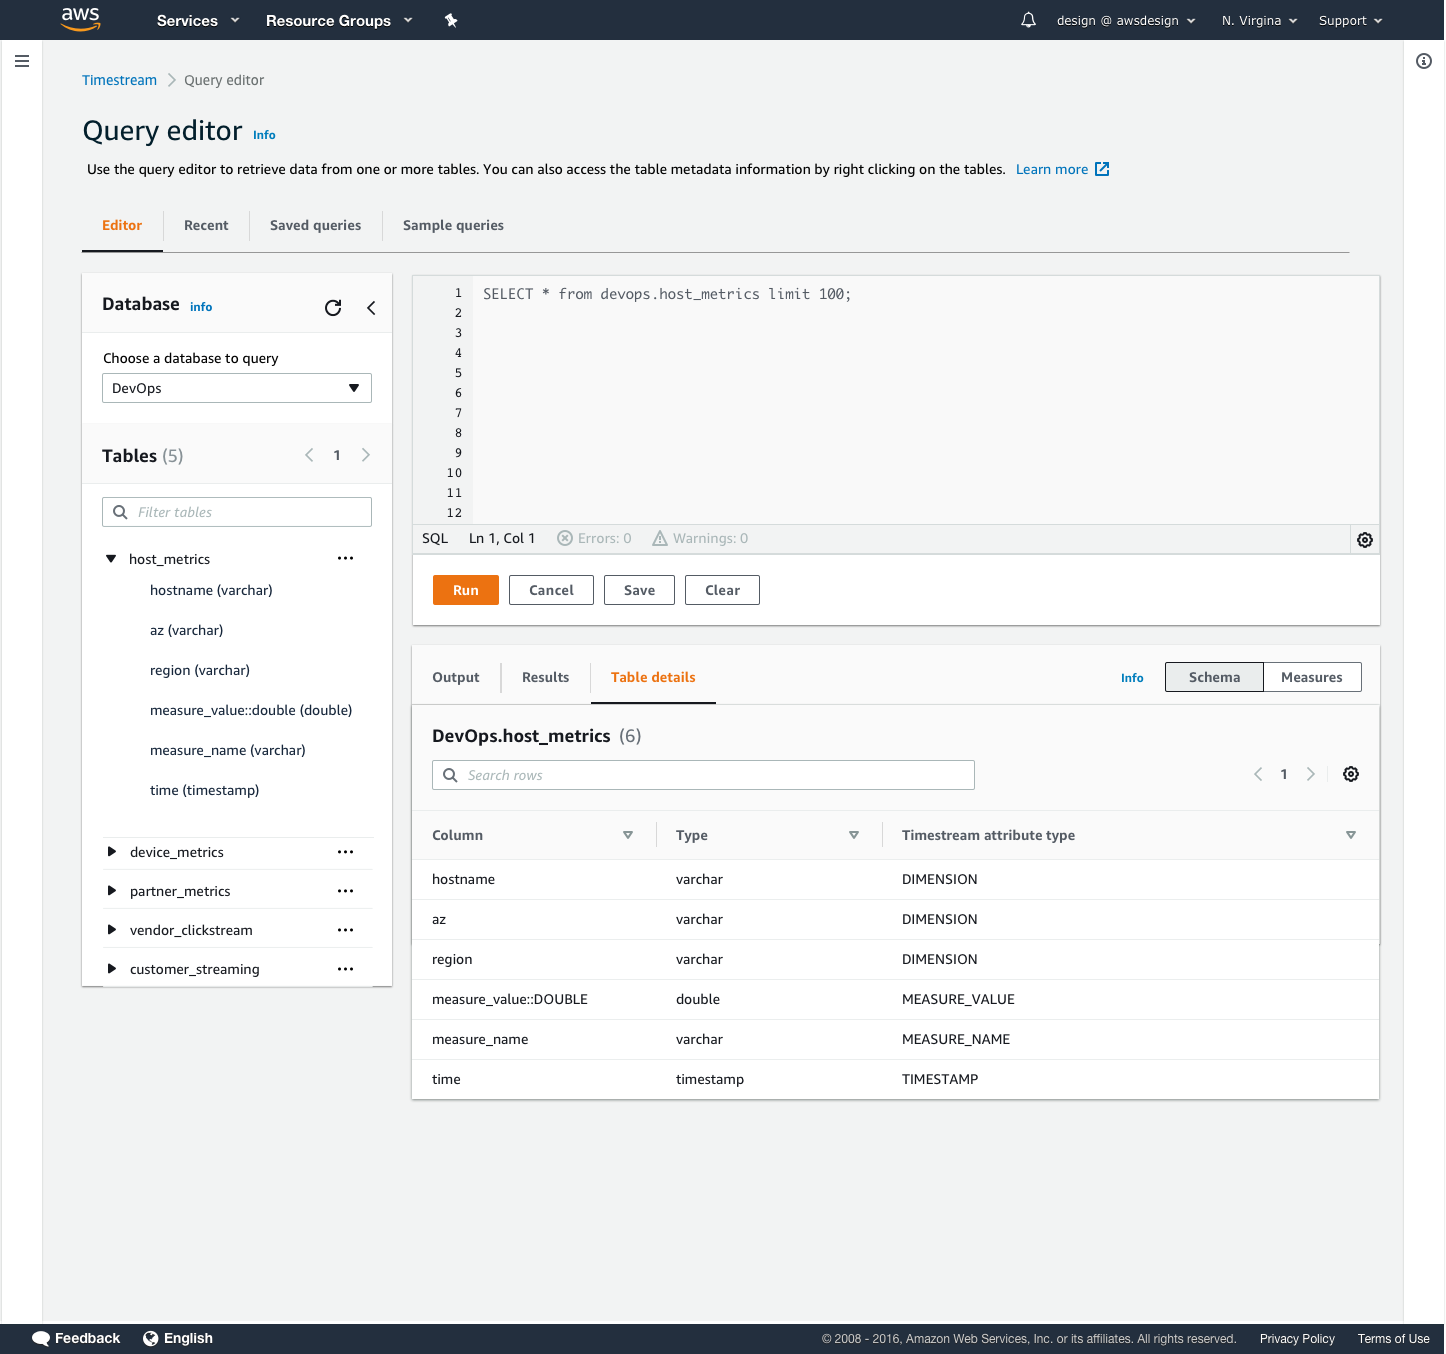
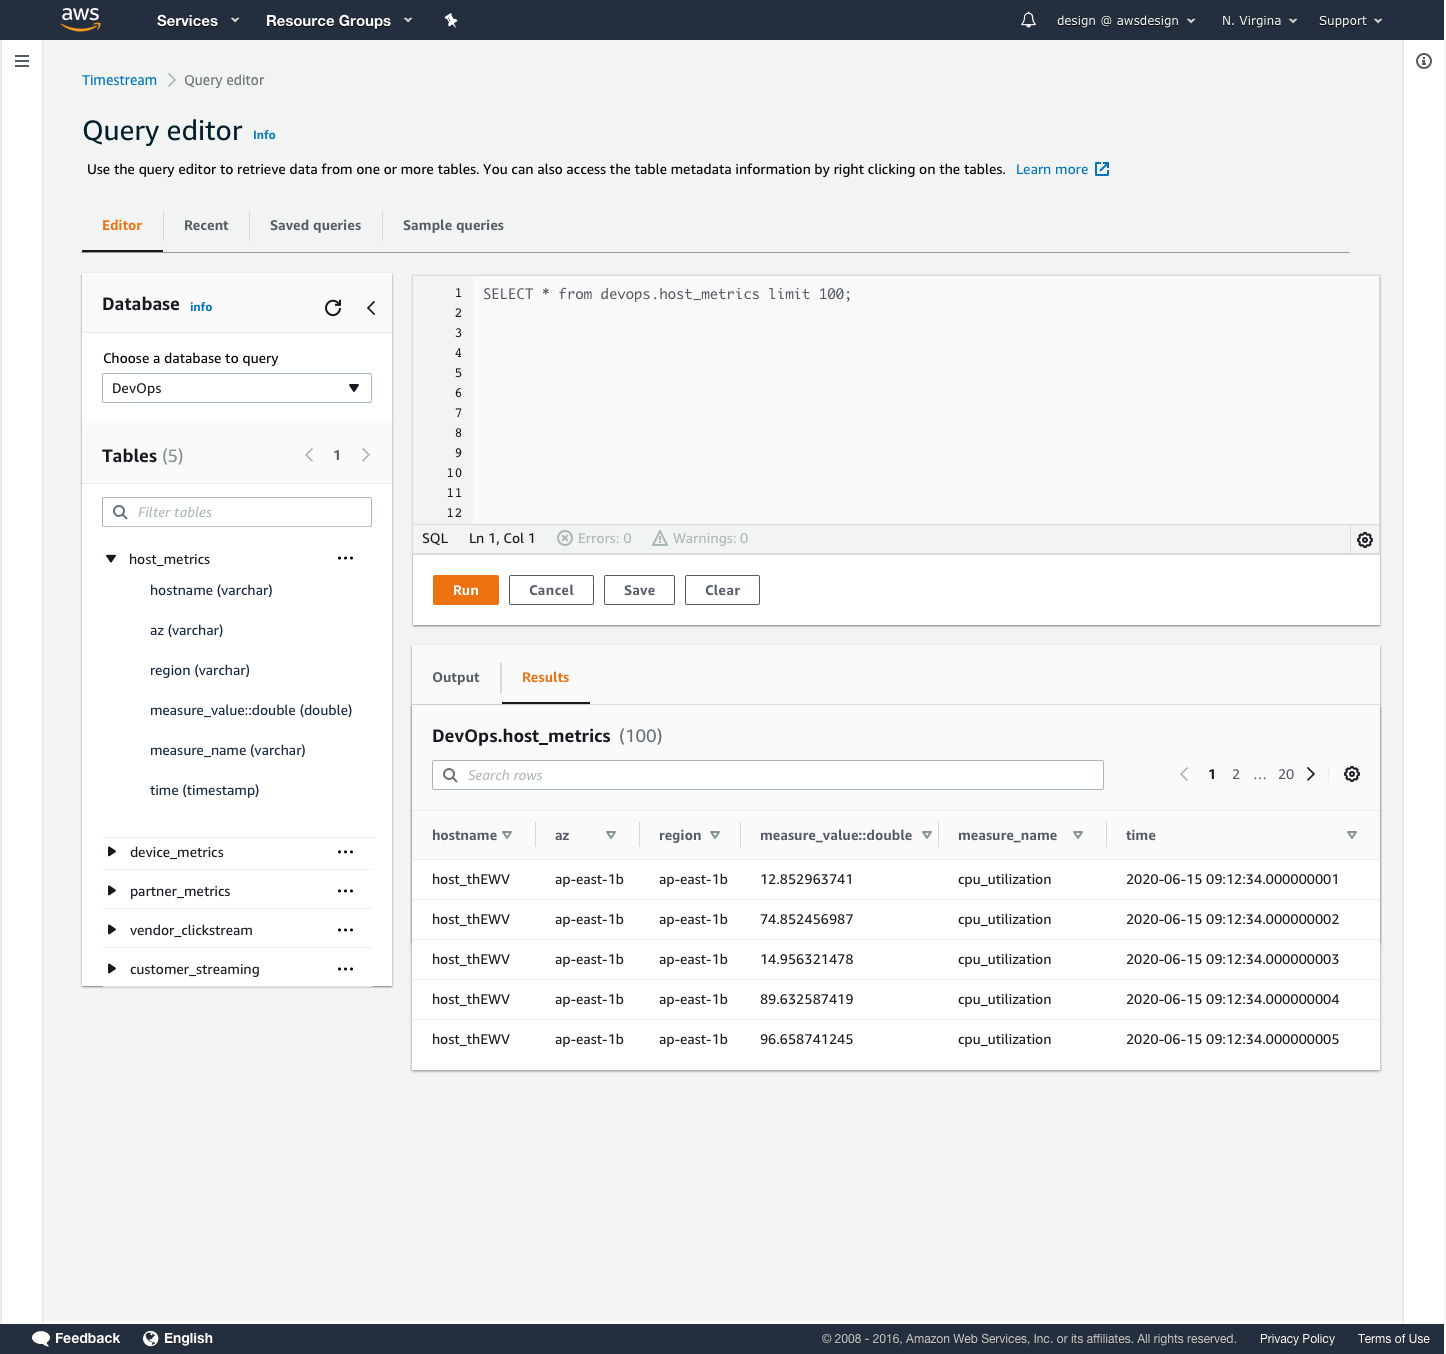
I created a decision flow for users to preview their data, view table schema, and view a list of dimensions, or parameters, for their table. In this diagram, users preview their imported database table by choose a preview of the first 100 rows of data. They are also able to quickly view the table schema, or column headers, and the measures, or the values taken at each timestamp.
User scenario
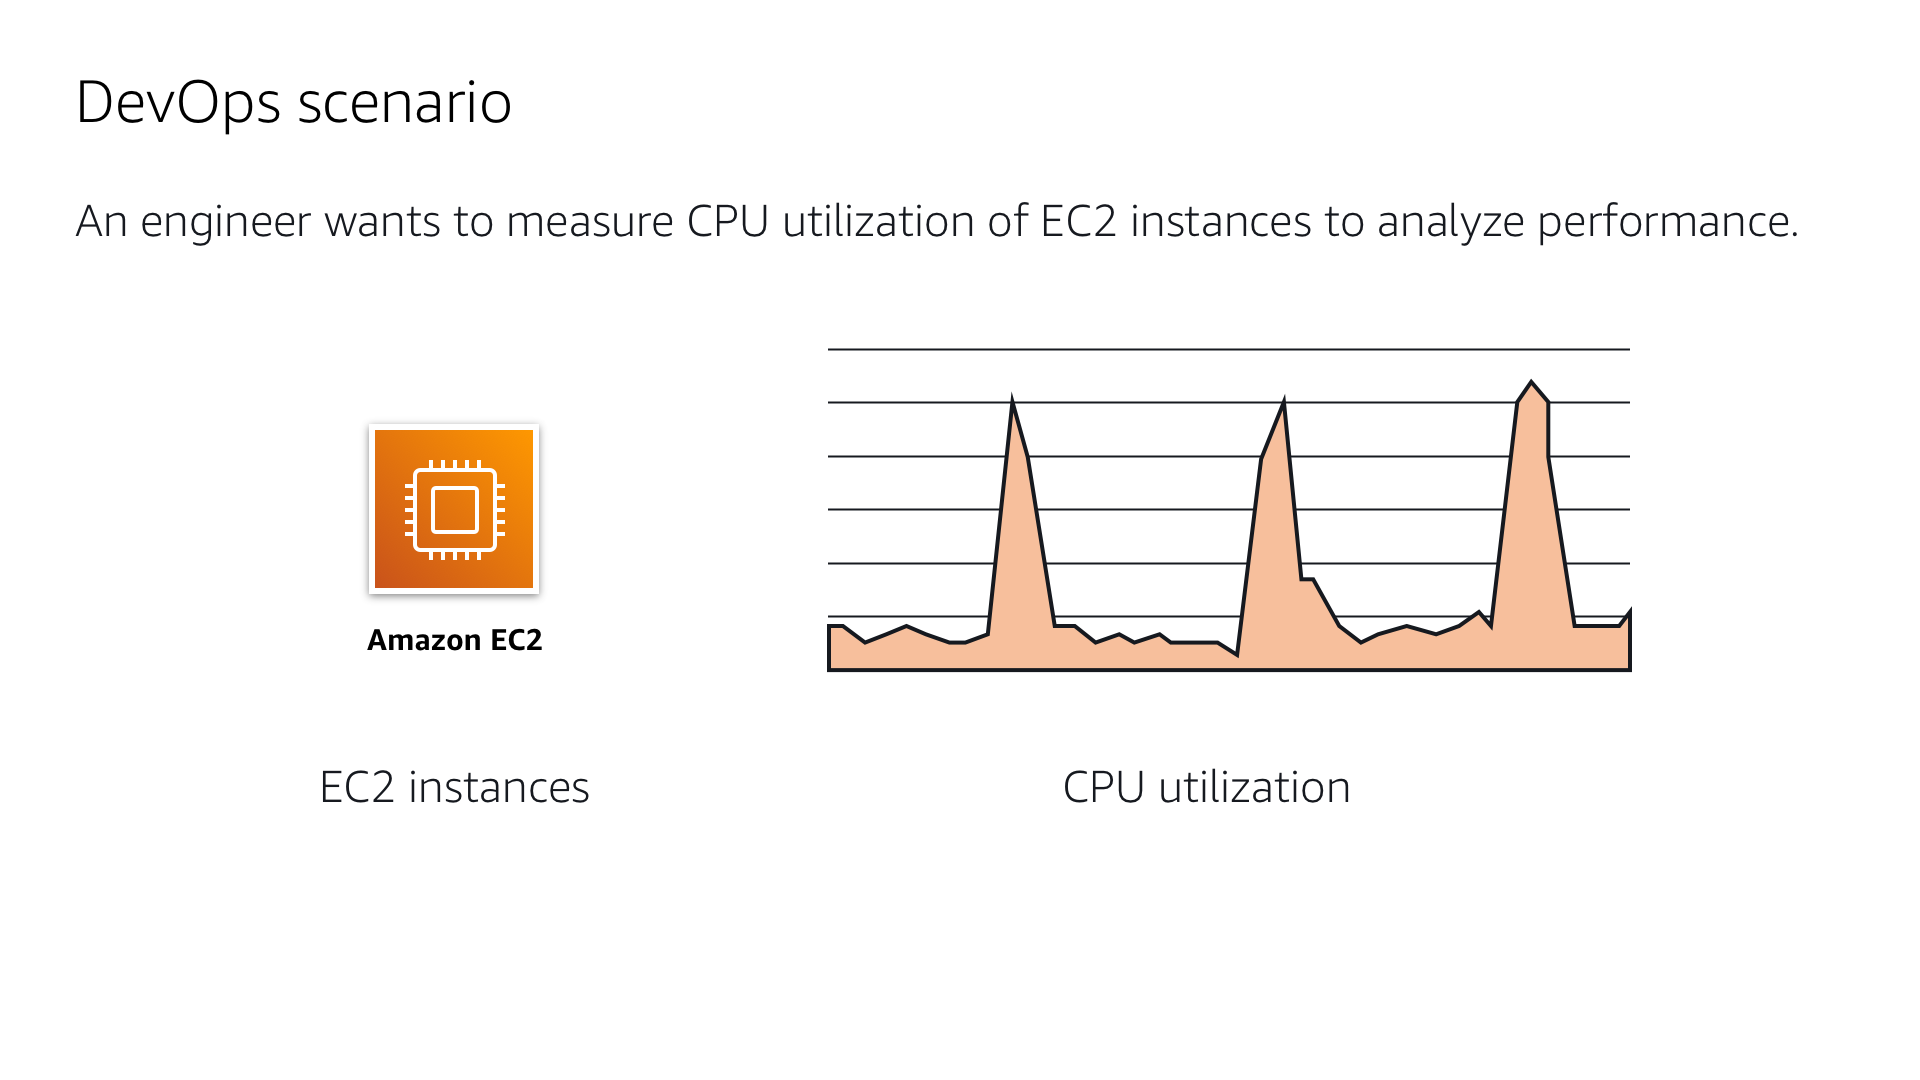
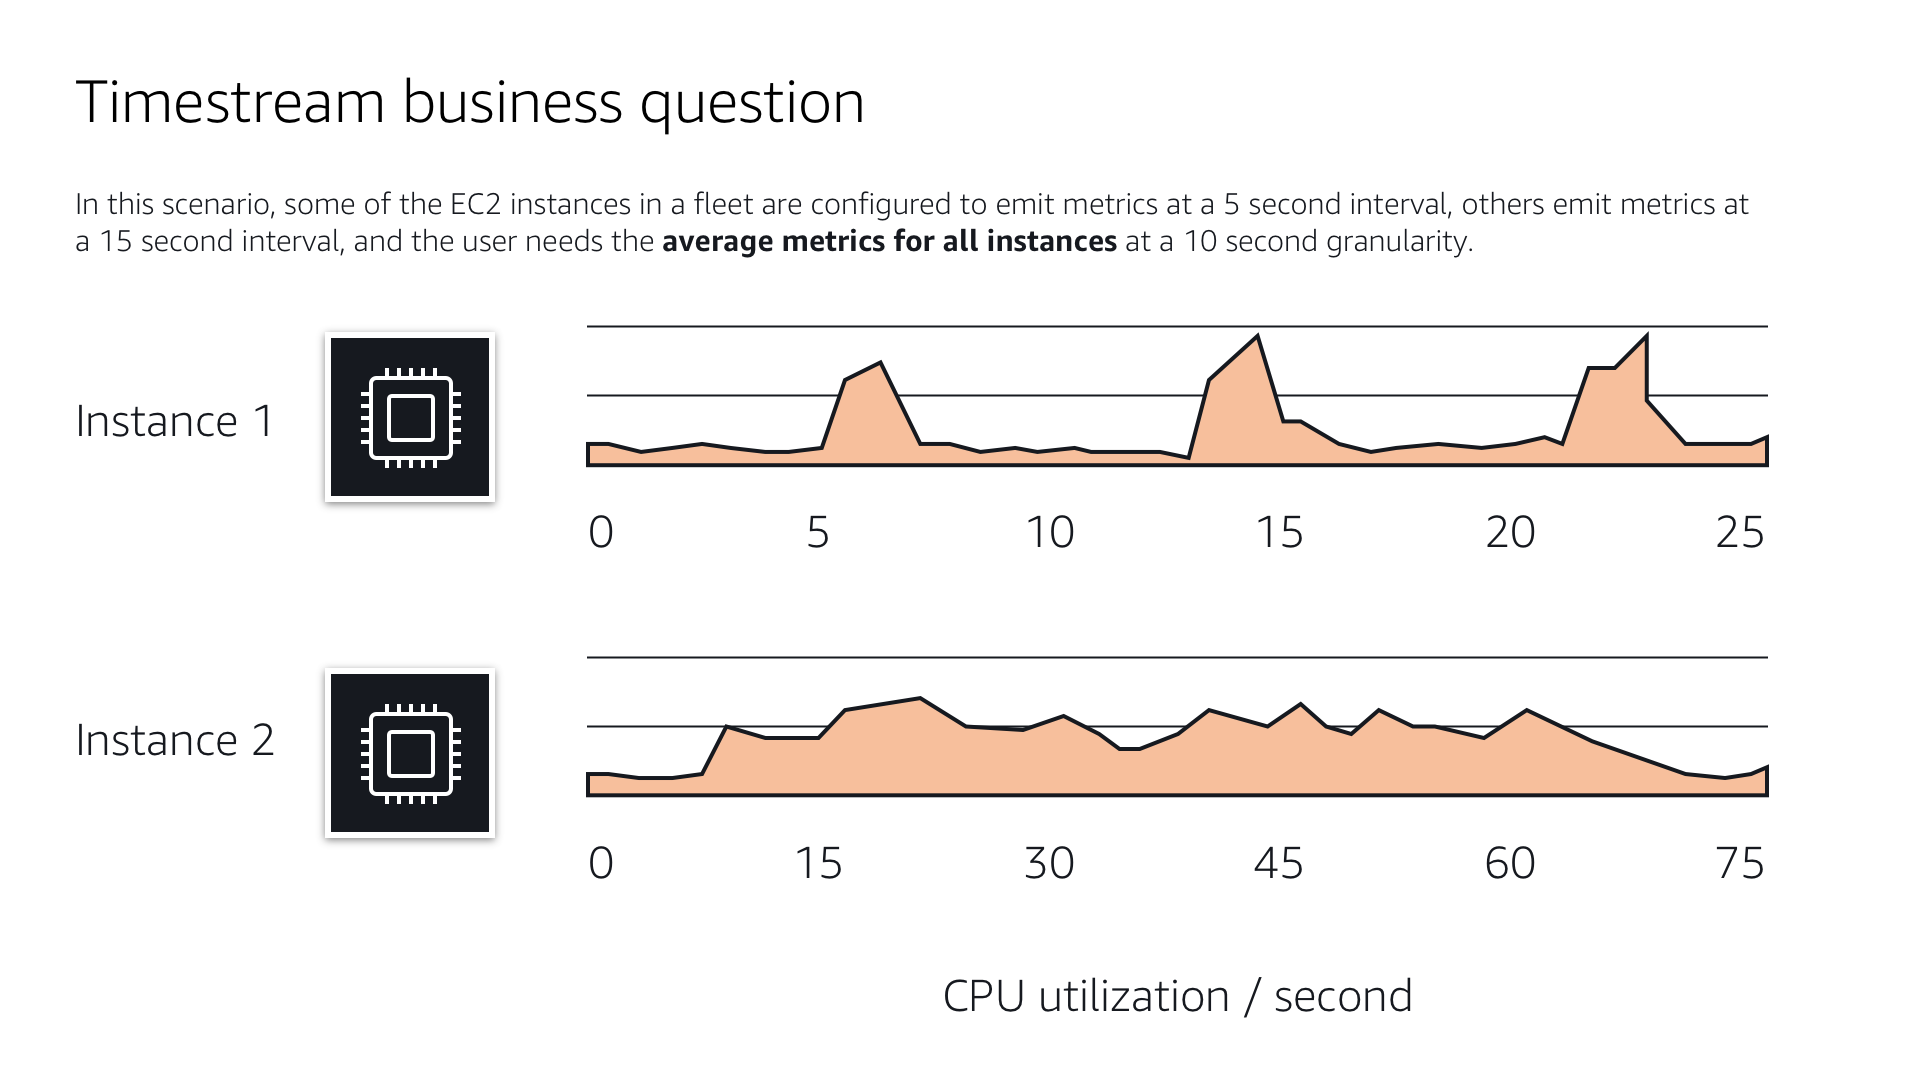
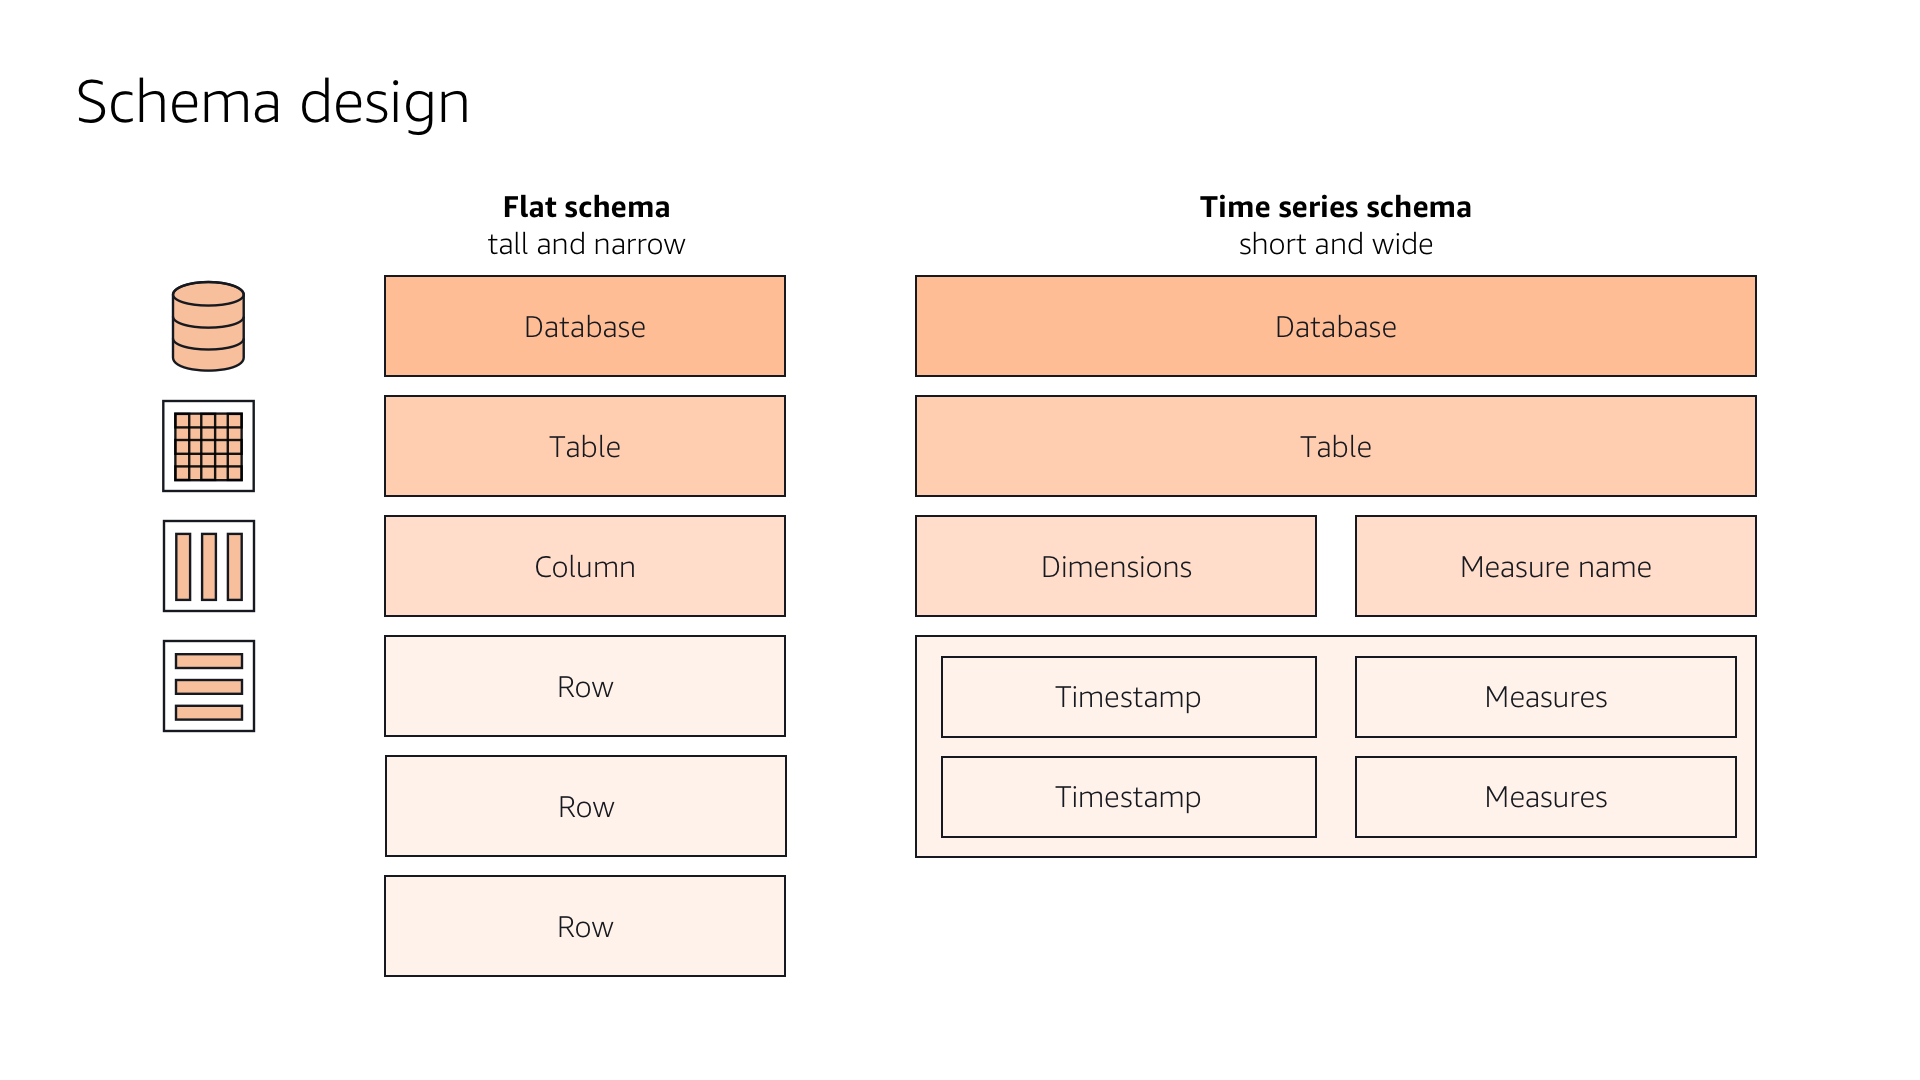
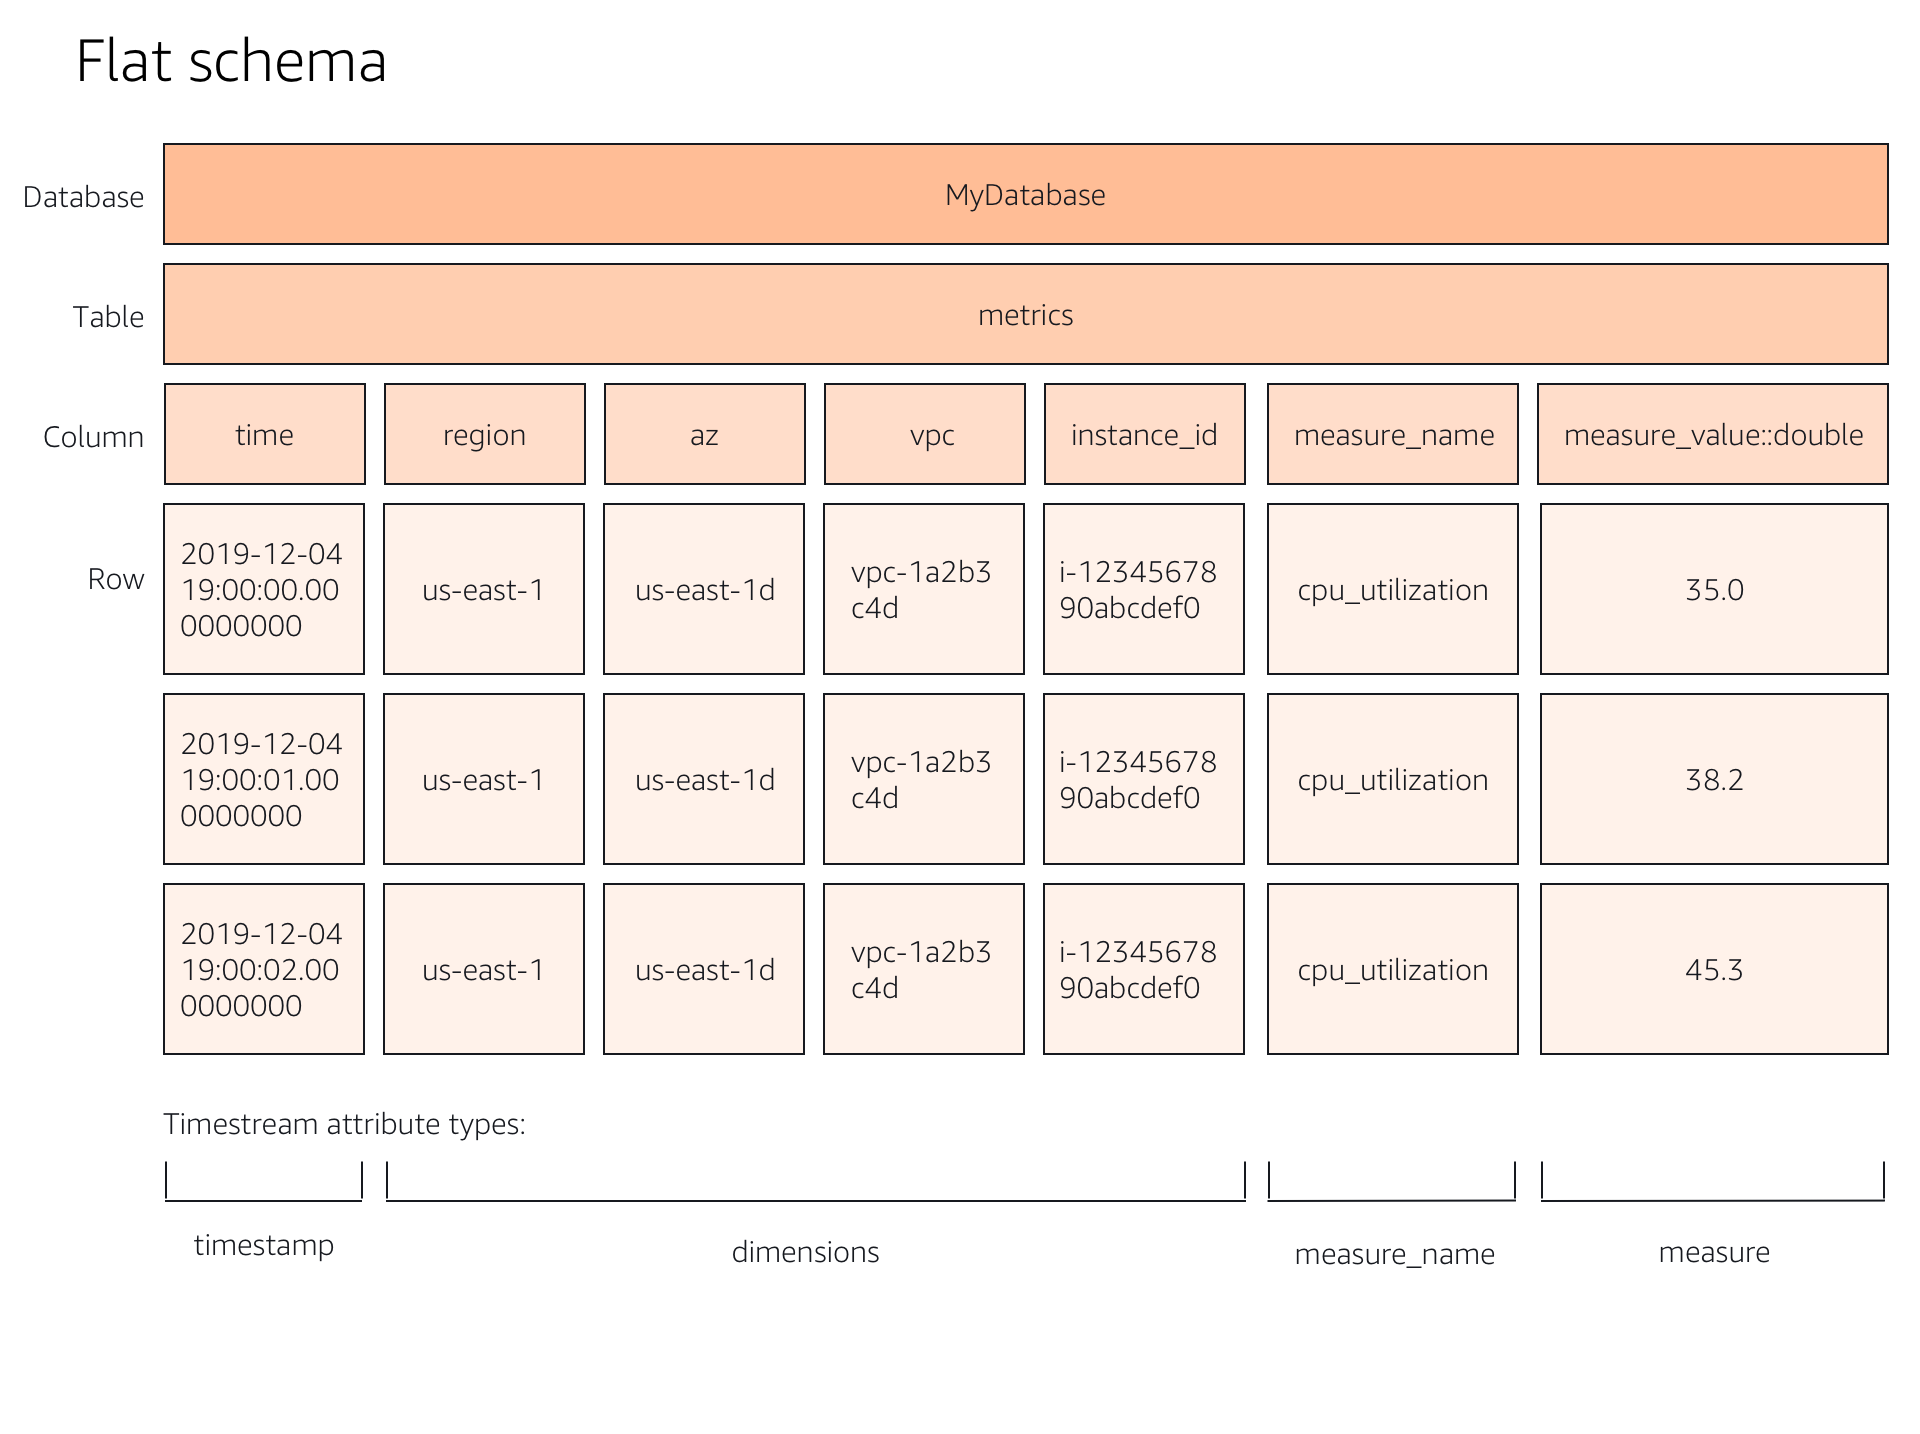
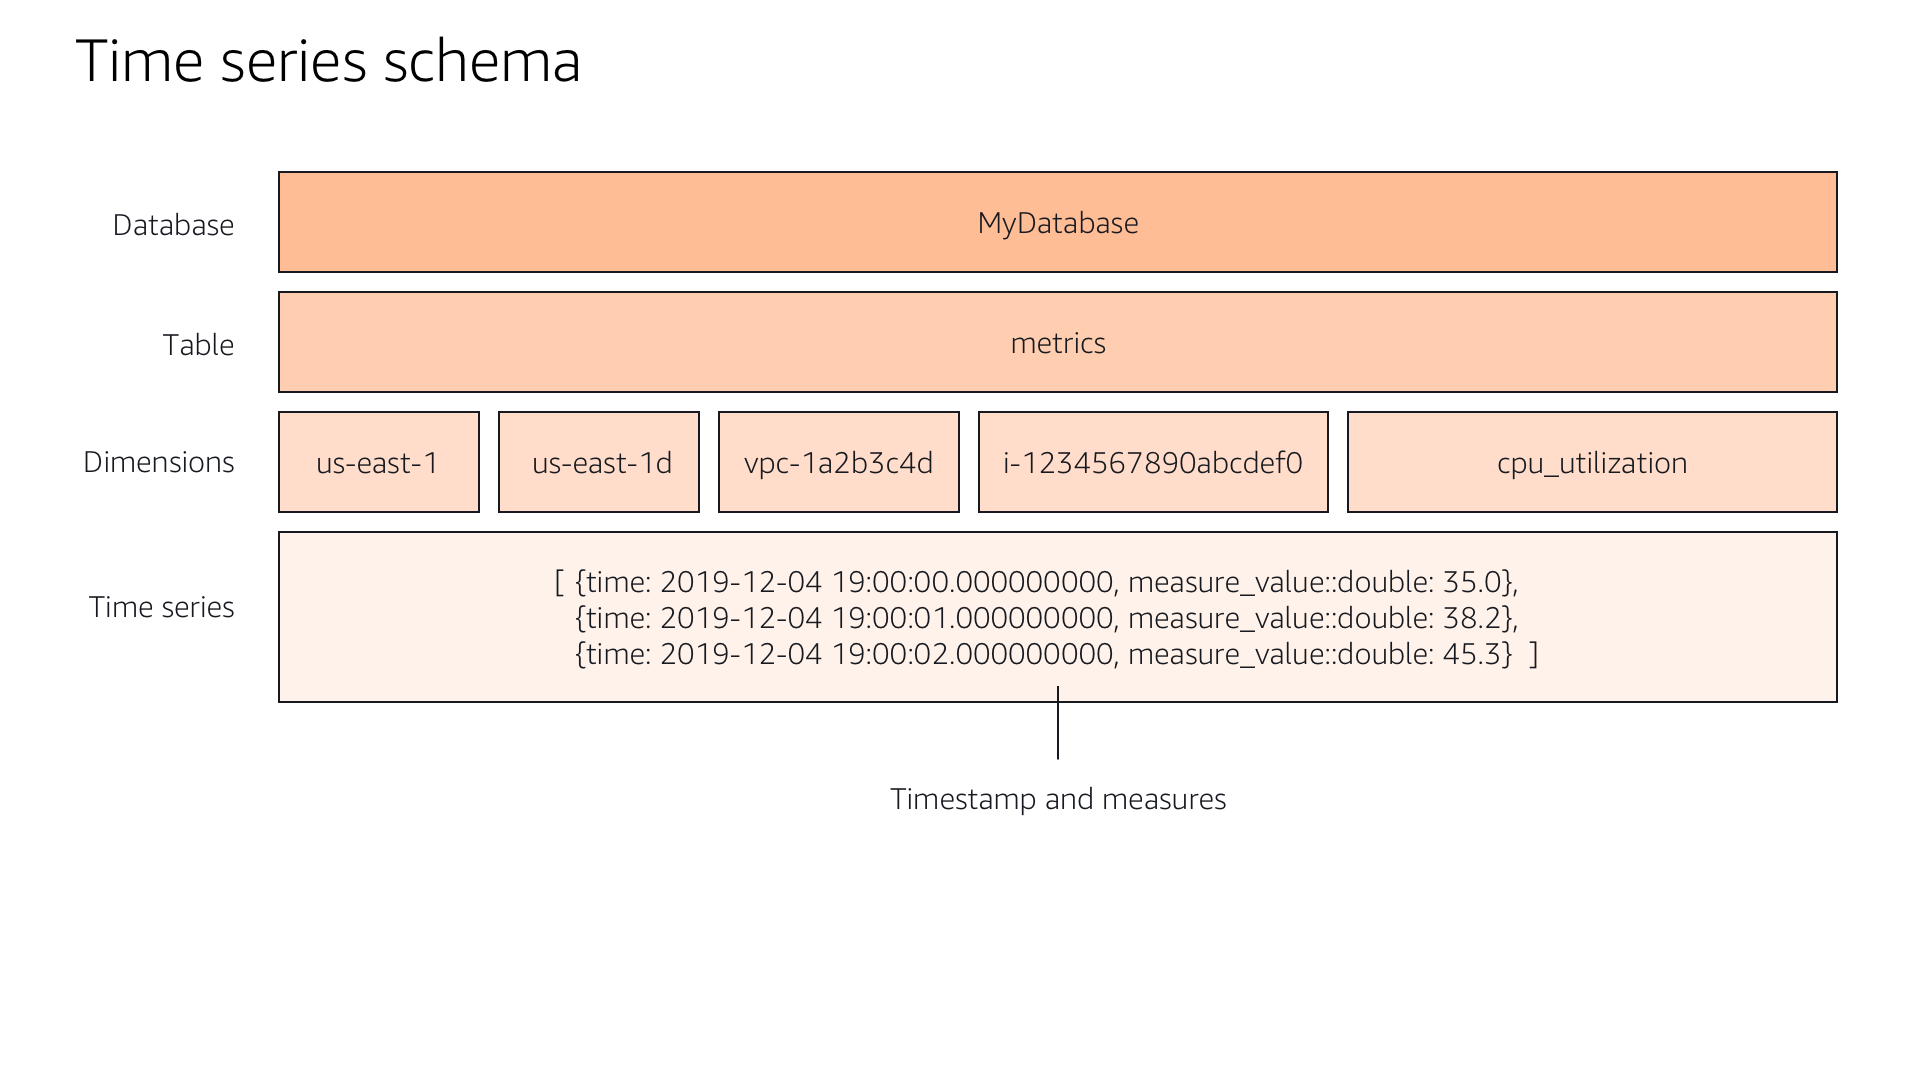
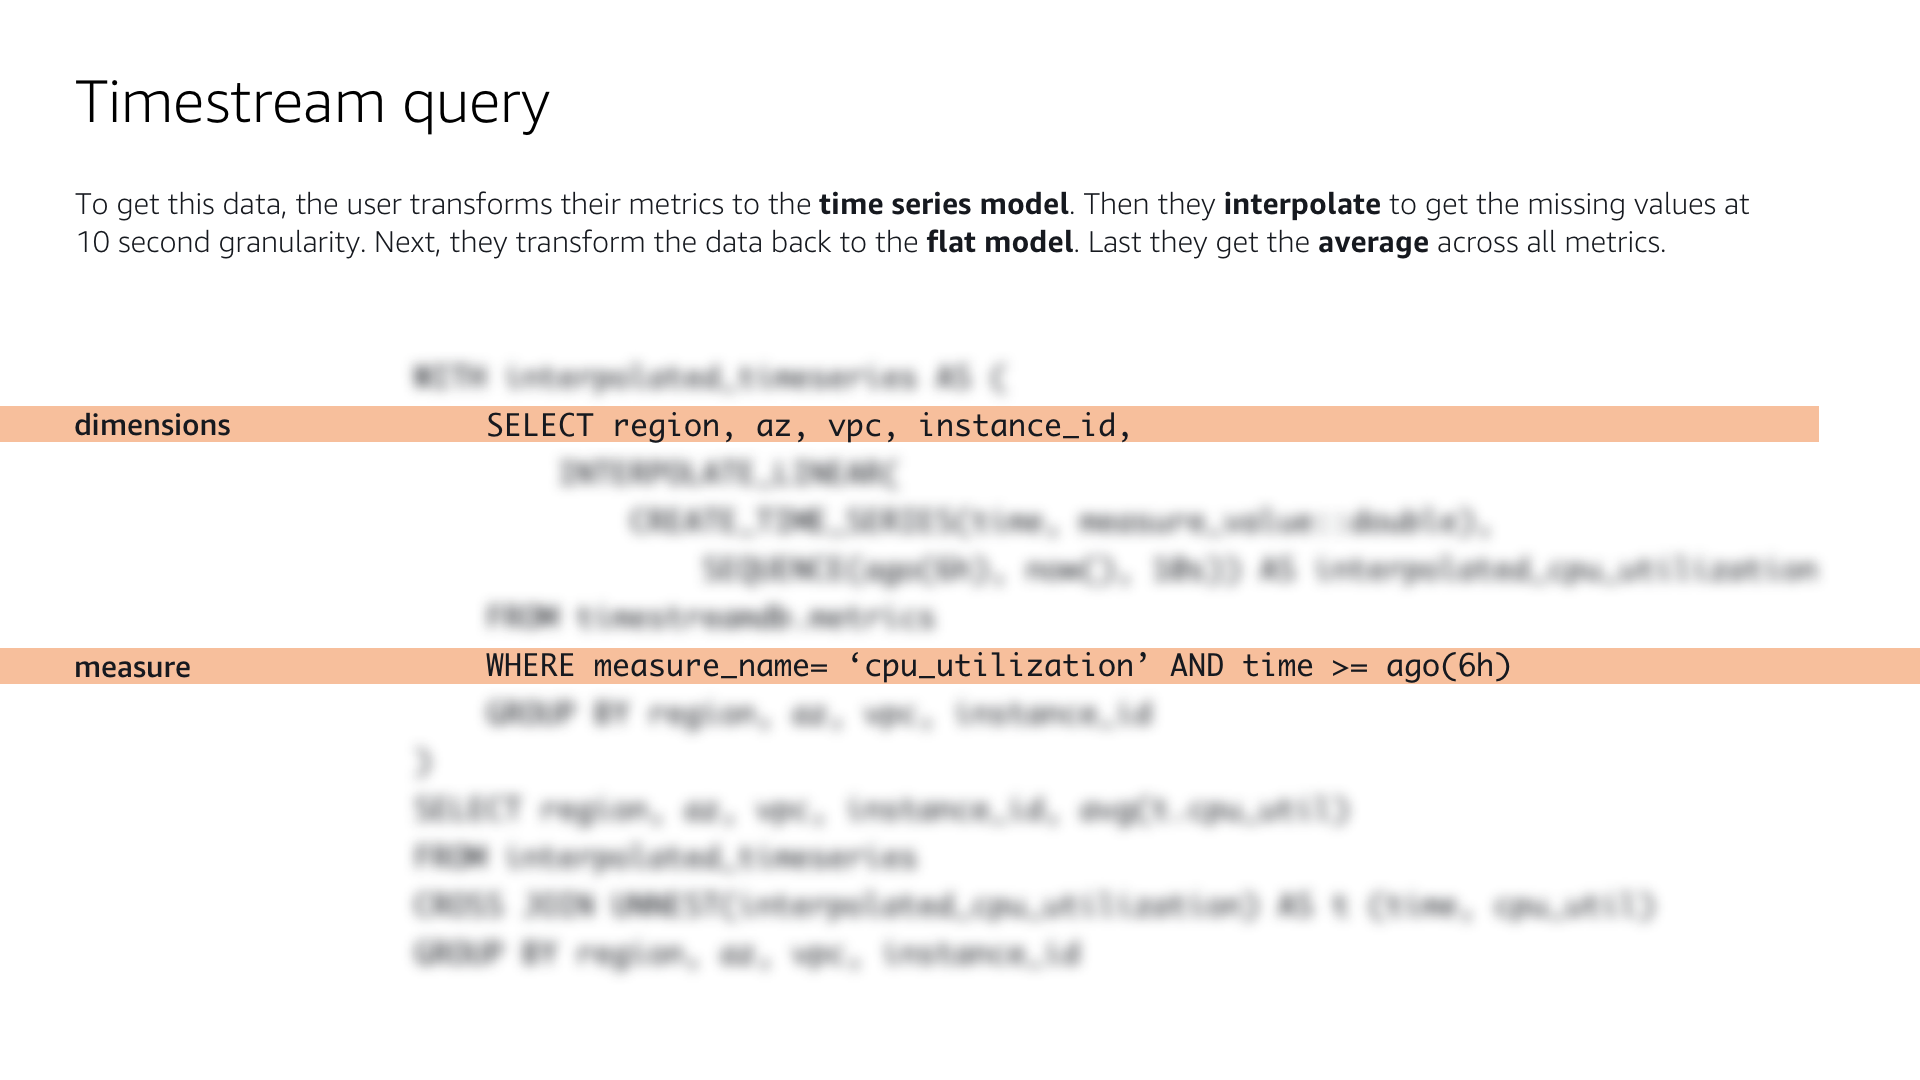
In a typical use case, a devOps engineer is using Amazon Timestream to measure the CPU utilization, or compute activity, of their EC2 instance virtual machines. They log the activity data into a database, then convert it to time-series structure to run queries against it. In the diagrams below, I illustrated the differences between flat and narrow schema versus the time-series schema model that Timestream requires. We wanted to give users an easy way to understand the difference between the two data structures and make them comfortable with viewing the data in the required formats.
Customer goal
Users needed an easy way to view and query their incoming data in Timestream. We provided quick, pre-written queries to help them view their time-series data in various ways. A 100-row preview allowed them to sample the dataset and familiarize themselves with the structure. The schema query allows users to view a list of all the data types and attributes in their data set. The measures query allows users to view what measurements are being taken and their respective data types.
Interface design
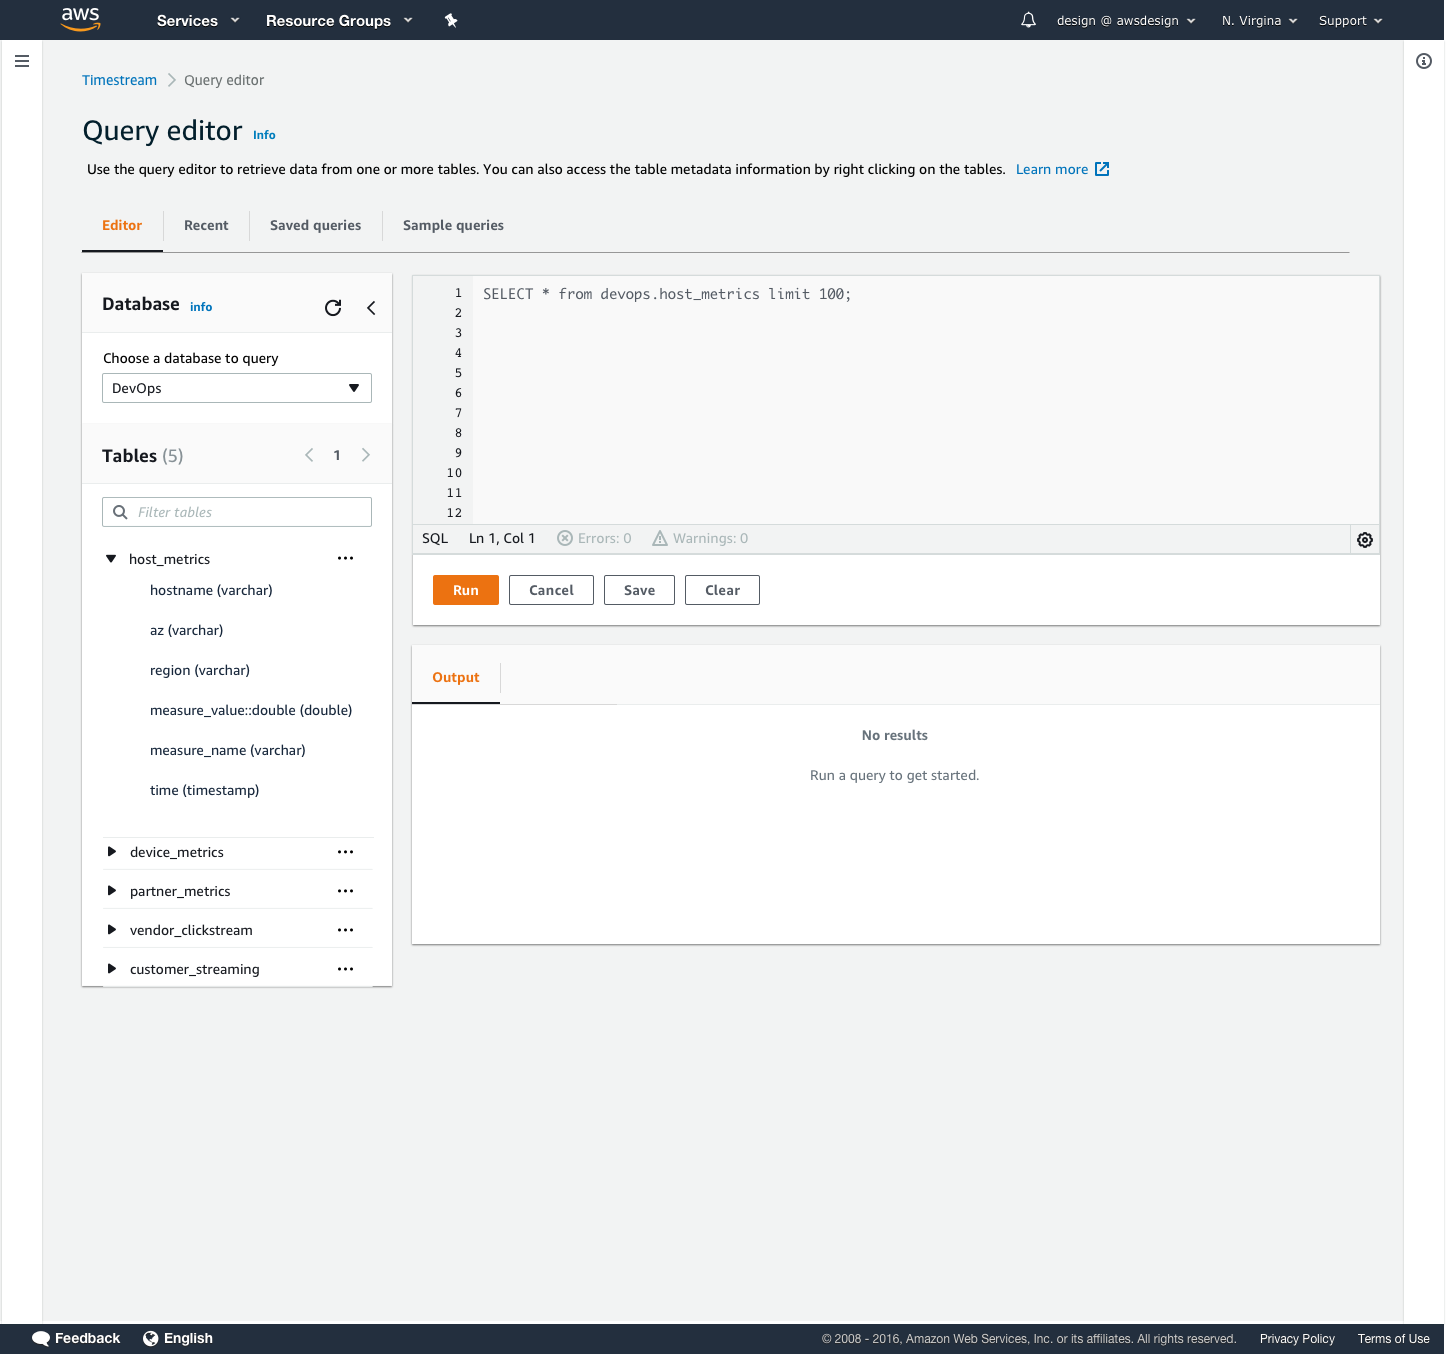
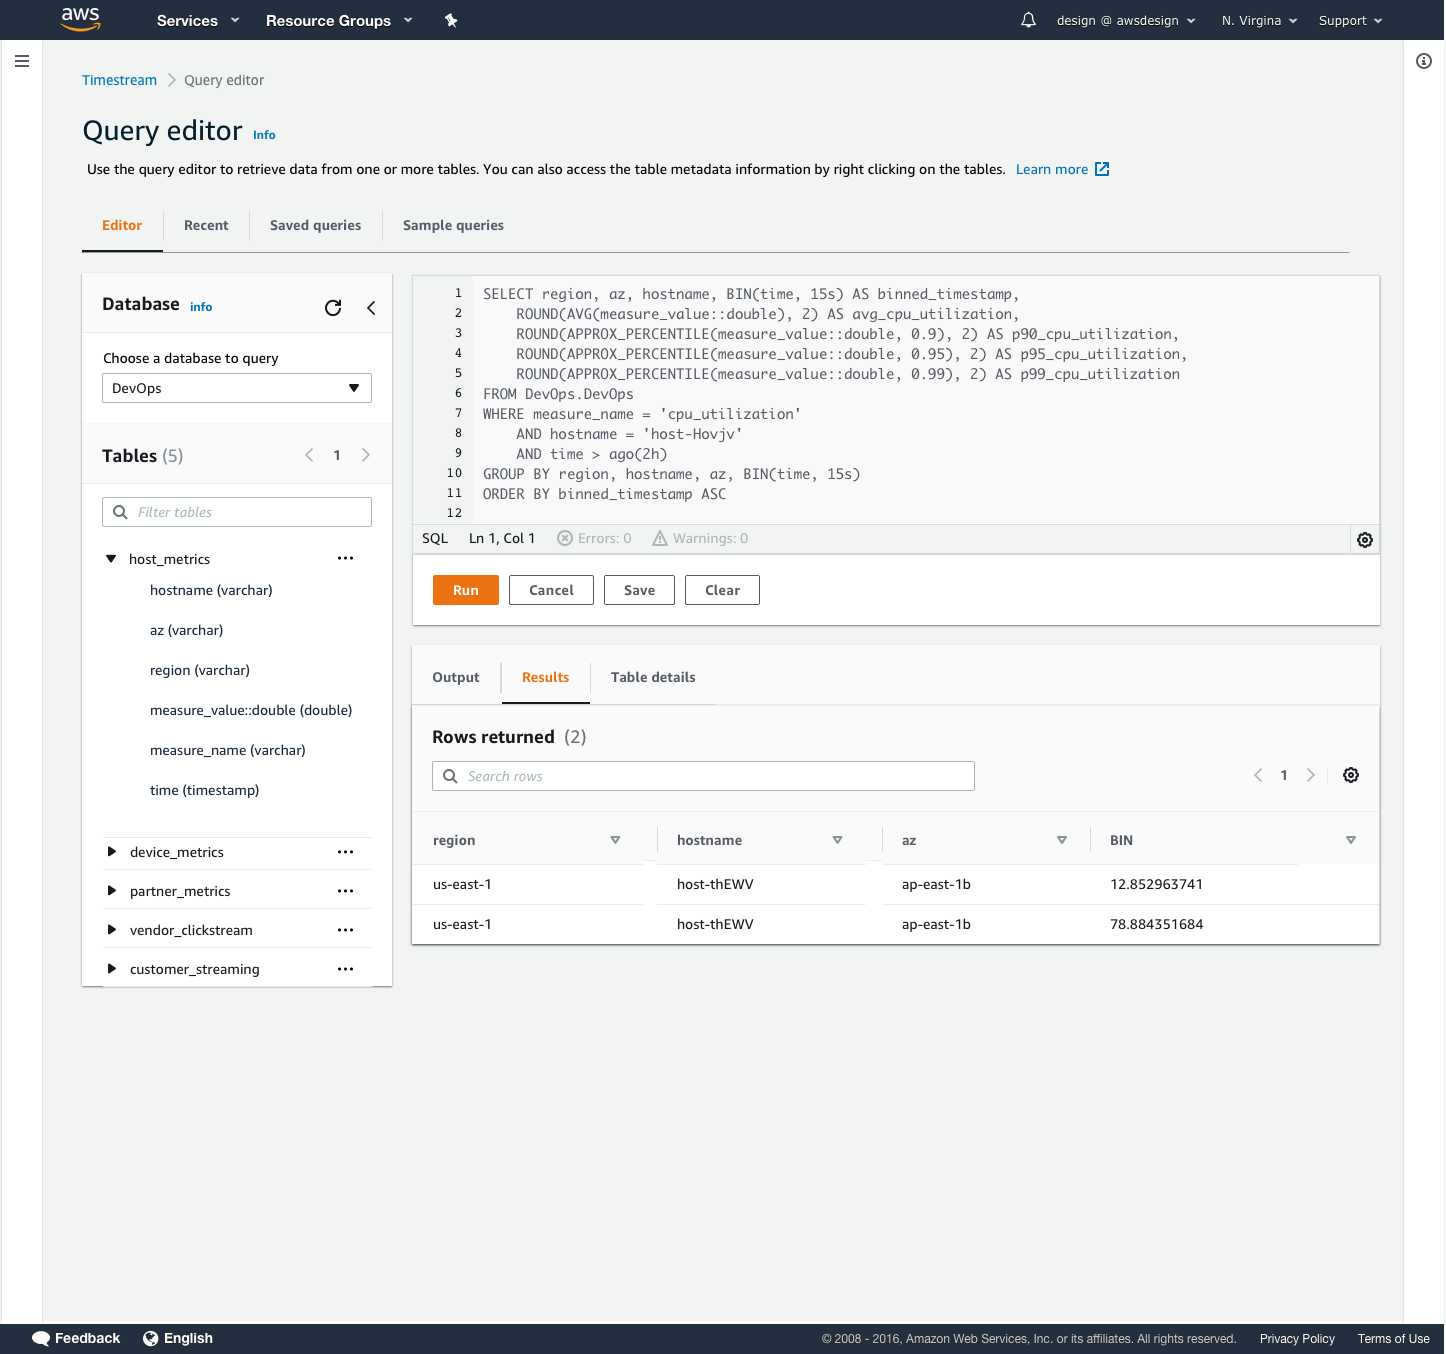
In the query editor design, I introduced a toggle button for users to switch between viewing their query results as table schema or measure values, so that users could more easily consume their data without having to write a new query. I also introduced additional tabs in the query results section so that users could see information about their table and refer to it when writing new queries. The query editor design is part of a community pattern to which these additional features were contributed for re-use by other AWS service consoles.
